Polyhydroxyalkanoates (PHA) Market Size
Ukhi Bioplastics Private Limited India
- A detailed examination of why 2025–2026 marks the critical transition of PHA from a high-cost medical niche to a scalable industrial material, including capacity forecasts through 2030.
- An accessible breakdown of Next-Generation Industrial Biotechnology (NGIB), explaining how salt-loving “extremophiles” and seawater-based fermentation are slashing production costs.
- Granular snapshots of 12 global powerhouses, including China’s massive scaling, Japan’s retail integration, Brazil’s energy-independent production, and India’s emerging ag-waste potential.
- Comprehensive profiles of the “Big Nine” global leaders and specialized innovators, covering their patented extraction methods, production capacities, and strategic alliances.
- Practical analysis of “White Spaces” in the market, focusing on PHA’s entry into the CO2-to-plastic and polyurethane-replacement sectors.
Publication Details
Publication Date: 20th February 2026
Publisher: Ukhi India Pvt. Ltd.
Location: New Delhi, India
Report Period Covered: 2018–2030
Data Last Updated: October 2025
Disclaimer
This report is based on data and information available from government publications, peer-reviewed research, and verified industry sources as of February 2026. While every effort has been made to ensure accuracy, Ukhi does not guarantee completeness in cases where official data is unavailable or incomplete. The report prioritizes factual integrity and transparency over speculative modelling.
EXECUTIVE SUMMARY
PHA at a Turning Point in 2026
The year 2026 marks a structural turning point for Polyhydroxyalkanoates (PHA).
For more than two decades, PHA has existed at the edges of the bioplastics industry. It has been technically impressive, environmentally superior, but commercially constrained.
In 2026, that balance begins to shift.
Three forces converge at this moment.
- First, regulatory pressure is in full force on the plastic producing and consuming industries. More than 50 countries have enacted bans or restrictions on conventional single-use plastics already. This has created an enforced demand for materials that can safely degrade outside controlled industrial systems, and PHA is an important one.
- Second, industrial technology relevant to PHA has matured. The bioplastics industry (particularly with reference to PHA value chains) is moving beyond early, expensive fermentation models.
- Third, market pull has become sector-specific. PHA IS gaining traction in applications where its unique properties are absolutely necessary.
As a result, PHA is transitioning from a future material to a polymer relevant today, especially in environmentally sensitive and high-value applications.
Five Things You Need to Know Now
- PHA is uniquely biodegradable in real world environments.
It is the only fully biosynthesized polymer certified to biodegrade in soil, freshwater, and marine conditions. Unlike materials such as PLA, which depend on industrial composting, PHA can break down under ambient conditions and reduce long-term microplastic risk. - Cost remains the single largest barrier.
Despite progress, PHA remains 3 to 10 times more expensive than traditional Polyethylene (PE), with raw materials alone making up 50% of the bill. Downstream recovery and purification account for up to another 50%. Cost reduction is therefore not incremental, it is more structural. - The industry is shifting to waste-based feedstocks.
Municipal food waste, sewage sludge, spent coffee grounds, and captured CO₂ are now central to PHA R&D strategies. PHA produced from urban biowaste has already demonstrated lower environmental impact and lower societal costs than fossil-based polyurethane in comparable applications. - Next-Generation Industrial Biotechnology (NGIB) is changing the economics of PHA.
The transition to Next-Generation Industrial Biotechnology (NGIB) is now active. The use of halophilic (salt-loving) bacteria allows for unsterile, continuous production in open tanks, which drastically lowers capital requirements. - PHA is not one material.
With over 150 different monomers, PHA can be engineered to be as rigid as a car bumper or as flexible as a rubber band.
Global Market Size Snapshot
The global PHA market remains small in absolute terms but is expanding rapidly.
As of 2023, market size estimates for PHA ranged widely (from USD 93.55 million to USD 650.7 million). This reflects differences in how analysts define scope and applications.
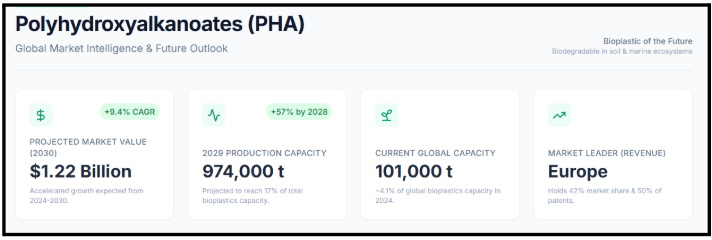
Despite this variance, all projections point towards PHA’s accelerated growth. By 2030, the market is expected to reach approximately USD 1.22 billion.
With a Compound Annual Growth Rate (CAGR) of between 14.2% and 29.4%, PHA is outstripping the growth of almost all fossil-fuel based polymers.
From a volume perspective, global PHA production capacity crossed 70,000 metric tons in 2024. This represented about 4.1% of total global bioplastics capacity.
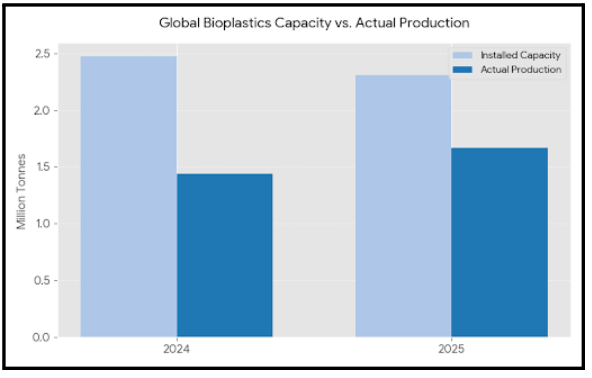
Installed Capacity vs Demand Gap
Despite rising interest, the PHA market is constrained by a gap between installed capacity and effective demand.
1. Across all bioplastics (not merely PHA), capacity utilisation stood at around 58% in 2024. This meant a production of roughly 1.44 million tonnes against installed capacity of 2.47 million tonnes. This utilisation rate is expected to have risen to 72% by 2025.
2. In PHA specifically, more than 120 companies are engaged in research or early-stage production. Their aggregate capacity still trails the massive demand created by European and North American packaging mandates.
3. The “sterile batch” bottleneck remains. Until NGIB (Next-Gen) plants reach the 50,000-tonne individual scale, we will continue to see a deficit in available resin for multinational converters.
Ukhi explains: The “sterile batch” bottleneck refers to the intensive technical and financial burden of maintaining a 100% contaminant-free environment during the fermentation process.
Because PHA is produced by “feeding” specific bacteria, any foreign microbe that enters the tank can quickly outcompete the production strain, as it can eat the expensive feedstock without producing any plastic.
To prevent this, traditional factories must follow a “sterile batch” protocol:
- High Energy Costs: Large volumes of water and growth media must be pressurized and heated to over 121°C (autoclaving) to kill all existing microbes before every new batch begins.
- Downtime: After each batch is harvested, the entire bioreactor must be deep-cleaned and re-sterilized. This process can take hours or even days, during which no plastic is being made.
- Infrastructure Complexity: Maintaining “aseptic” (sterile) conditions requires expensive stainless-steel tanks, specialized air filtration, and complex piping to ensure no leakage of outside air occurs.
This creates a bottleneck because it makes scaling up to 50,000+ tonne facilities exponentially expensive. Every increase in tank size requires more energy to heat and more sophisticated engineering to keep sterile.
Next-Generation Industrial Biotechnology (NGIB) solves this by using “extremophile” bacteria that thrive in high-salt or high-pH environments where most common contaminants simply cannot survive. This allows for unsterile, continuous production in cheaper, open tanks.
On the demand side, PHA’s high prices restrict its adoption to premium segments such as medical devices, agriculture, and regulated packaging. However, policy-driven demand is beginning to pull PHA into larger volume applications despite the cost gap.
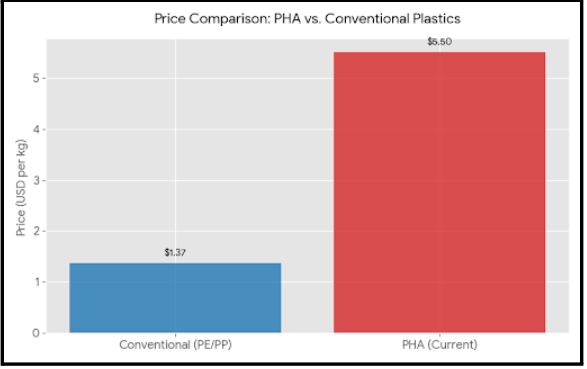
Price Comparison
Price is the most visible challenge for PHA.
The key cost drivers are:
- Feedstocks, accounting for 50–60% of production cost
- Downstream recovery and purification, accounting for 30–50%
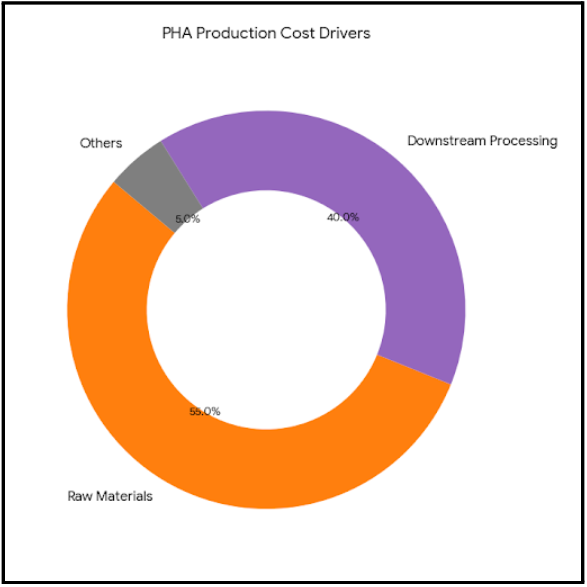
So, technologies that reduce feedstock cost and simplify recovery will determine whether PHA can compete beyond premium niches.
Ukhi explains: At Ukhi, we believe in radical transparency regarding cost. Parity with oil-based plastics is not yet here, but the gap is narrowing.
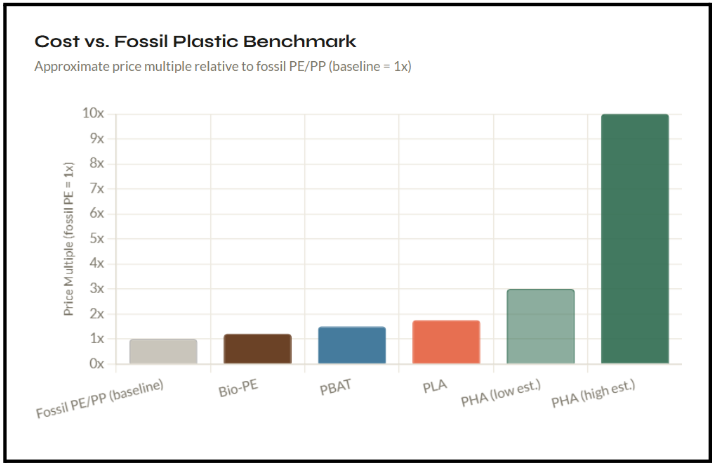
| Material Type | Price Range (USD/kg) | Relative Comparison |
|---|---|---|
| Fossil Plastics (PE/PP) | $1.00 – $1.74 | The Global Benchmark |
| PLA (Polylactic Acid) | $2.00 – $3.00 | Mature Bioplastic |
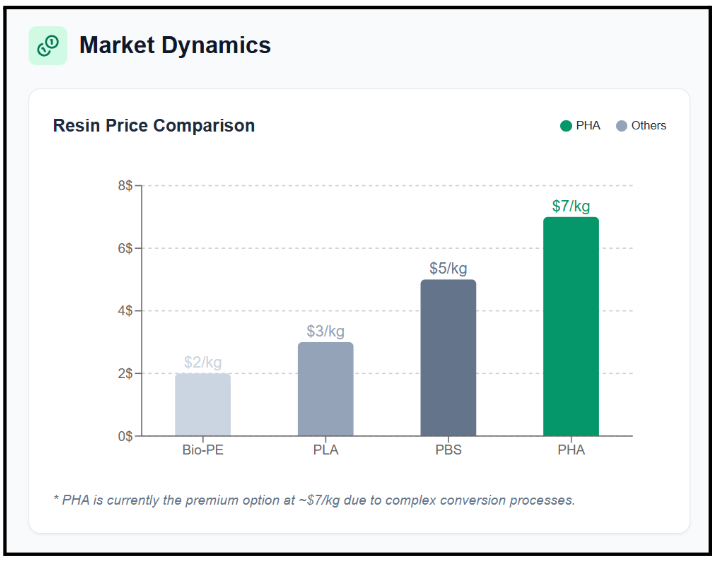
| PHA (Current) | $4.00 – $7.00 | The Premium Tier |
| PHA (Historical – 2002) | $9.50 | Historical Reference |
What This Means for Stakeholders
- For Brand Owners: Incorporating PHA is currently a Brand Equity play. The higher cost must be offset by the marketing value of a truly marine-safe product.
- For Manufacturers: Focus on Copolymers (like PHBV). They are less brittle than pure PHB and provide a wider processing window, which means less machine downtime and wasted material.
- For Investors: The area of focus is Downstream Processing. Any technology that can reduce the 30–50% cost of extracting PHA from the bacteria is a high-value acquisition target.
The Bottom Line
PHA enters 2026 at a decisive moment.
Its environmental advantages are no longer debated.
Its technical limitations are understood and addressed.
What remains unresolved is scale and cost.
If next-generation production models deliver as expected, PHA will move from a niche sustainability material to a core polymer for regulated, high-impact applications.
If not, it will remain constrained to premium segments.
2. About This Report
This Ukhi PHA Market Research Report 2026–2030 is intended as a comprehensive and practical guide for decision-makers trying to make sense of the most complex and promising segment of the bioplastics industry — polyhydroxyalkanoates (PHA).
Our purpose is to provide a single source of truth that uses technical data and market analysis to deliver plain-language actionable insights for business leaders and policy architects.
2.1 Scope of the Report (PHA only)
This analysis focuses exclusively on the Polyhydroxyalkanoates (PHA) family of polymers. Unlike broader bioplastic reports, our analysis is focused on the PHA value chain, including:
- Global and regional market size and growth,
- Feedstocks, production methods, and technological advances,
- Application areas (e.g., packaging, agriculture, medical, consumer goods),
- Regulatory and policy landscape,
- Competitive dynamics and key players,
- Opportunities, risks, and major challenges facing the PHA industry.
2.2 Geographic Coverage (Global + 9 Countries)
The report provides a global outlook with deep-dive strategic profiles of9 key countries currently leading PHA innovation or adoption:
- Asia-Pacific: China, India, and Thailand.
- Europe: Germany, Italy, and United Kingdom.
- Americas: USA, Canada, and Brazil.
2.3 Time Horizon (2018–2030)
Our report analyses market trends and developments from 2018 through 2030, with:
- Historical (2018–2024): The ‘CIB’ (Conventional Industrial Biotechnology) era and early market
- Current State (2025–2026): The rise of Next-Gen fermentation
- Forecast (2027–2030): Capacity surges and the path toward cost parity with fossil-fuel plastics
2.4 Methodology & Sources
We base our findings on multiple independent data sources:
- Analysis of 2025/2026 investor filings and production reports from global bioplastics leaders
- Peer-reviewed scientific publications
- Industry whitepapers
- Policy documents and regulatory frameworks
- Expert interviews and presentations at global conferences
Where discrepancies or data gaps exist, we have chosen accuracy and transparency over completeness.
2.5 Limitations & Assumptions
- Market data on PHA is highly fragmented.
- Some figures are based on the most credible sources available as of publication (February 2026), but may be revised.
- Some “announced” industrial capacities may face delays due to downstream processing bottlenecks.
2.6 Note on Data Sources, Variations, and Our Approach
This report draws on multiple publicly available data sources, including industry associations, regional market studies, company disclosures, and policy documents.
Because the PHA and bioplastics sectors are still emerging, the data landscape is fragmented. Different analysts use different definitions, timeframes, and assumptions. As a result, market size and growth figures often vary — sometimes significantly.
Rather than hide these differences, we believe it is more responsible to explain them clearly.
1. Global Bioplastics Market – Data Variations
Production Capacity
One consistent reference point across sources is total global bioplastics production capacity:
- 2.47 million tonnes in 2024
This figure refers to installed production capacity across all bioplastics, not actual output.
Market Value
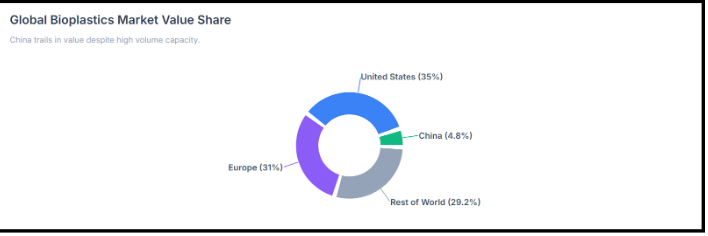
There is no single agreed global market value number across all sources. Instead, regional shares are often reported:
- United States: 35% of global value
- Europe: 31%
- China: 4.8%
These value shares are not contradictory, but they reflect different measurement bases — some include all bio-based plastics, while others focus only on biodegradable plastics.
Growth Rates
A single global CAGR for all bioplastics is rarely reported. Instead, growth is presented regionally:
- Europe: 11.46% (2025–2033)
- Australia: 7.6% (2025–2031)
These regional rates cannot be directly averaged into a global number because they cover different product mixes and baseline years.
2. Global PHA Market – Where Contradictions Are Most Visible
PHA data varies more sharply than overall bioplastics data. This is typical for smaller, early-stage markets.
A. Market Value – Wide Ranges
Reported estimates for global PHA market value differ substantially:
For 2023:
- Low estimate: USD 93.55 million
- High estimate: USD 650.7 million
For 2024:
- One estimate: USD 714.7 million
Future projections:
- USD 1.22 billion by 2030
- USD 1.5 billion by 2025 (aggressive scenario)
- USD 167–171 million between 2027–2034 (much lower projection)
These differences arise from:
- Whether medical applications are included
- Whether copolymers (e.g., PHBV) are included
- Whether forecasts assume rapid industrial scale-up
- Whether projections are volume-based or revenue-based
- Different baseline years
The smaller projection (USD 167–171 million) likely reflects a narrower product definition or conservative adoption assumptions.
B. Market Capacity / Volume – Conflicting Numbers
Installed capacity figures also vary:
- 70,000 tonnes in 2024
- 101,000 tonnes in 2024 (European Bioplastics estimate)
- A more conservative projection suggests global output will only surpass 50,000 tonnes by 2025
These are not necessarily contradictory. They may reflect:
- Installed capacity vs actual production
- Announced capacity vs operational plants
- Differences in reporting cut-off dates
The higher figure (101,000 tonnes) likely includes announced and partially commissioned facilities, while lower figures may refer to confirmed operational output.
Future projections show much larger numbers:
- 974,000 tonnes by 2029
- Representing 17% of total bioplastics capacity
This projection assumes aggressive industrial scaling and successful cost reduction.
C. CAGR Projections – Why They Differ
PHA CAGR estimates range widely:
- 14.2% (2020–2025)
- 14.7% (2023–2030)
- 9.4% (2024–2030)
- 29.4% (2026–2034)
The variation comes from:
- Different starting years
- Different baseline market sizes
- Conservative vs optimistic scaling assumptions
- Inclusion or exclusion of certain applications
A high CAGR (such as 29.4%) often reflects a small starting base. Even modest volume increases can produce a large percentage growth rate.
Our Approach in This Report
Given these variations, we have taken a deliberate approach.
- Where credible estimates differ, we show the range rather than force a single number.
- Where installed capacity appears significantly higher than confirmed output, we lean toward the more conservative, operationally verified figure.
- We do not assume that all announced plants will run at full capacity on schedule.
We distinguish clearly between:
- Installed capacity
- Actual production
- Market value
- Forecast scenarios
For modelling and comparative analysis, we use mid-range, realistic estimates.
These reflect:
- Confirmed operational capacity
- Documented policy drivers
- Observable commercial adoption
Note on Country-Level Data Interpretation
In several countries, dedicated and reliable data specific to PHA (Polyhydroxyalkanoates) is not publicly available.
In such cases, reporting bodies often publish figures only for total bioplastics (which may include PLA, PBAT, starch blends, bio-PE, and other materials).
Where country-level PHA-specific data was unavailable, we have:
- Referenced the broader bioplastics market size or capacity
- Examined the country’s known positioning in biodegradable or fermentation-based polymers
- Applied proportional or directional estimates cautiously
- Clearly distinguished between confirmed PHA data and inferred positioning
3. PHA: Core Concepts & Market Relevance
3.1 What Is PHA?
At its core, Polyhydroxyalkanoate (PHA) is not a single material, but a vast family of naturally occurring biopolyesters.
While we think of plastic as a synthetic invention of the 20th century, PHA has been produced by nature for billions of years. It is synthesized by over 90 genera of bacteria, archaea, and even certain microalgae.
Of course, these microorganisms don’t “make plastic” for human use. They create PHA as a survival mechanism.
When a microbe finds itself in an environment with plenty of carbon (its food) but not enough of other essential nutrients like nitrogen or phosphorus, it stores that excess energy internally.
It converts the carbon into hydrophobic granules (tiny, insoluble droplets tucked inside the cell membrane).
When the “lean times” come and food is scarce, the bacteria consume these granules to survive. Because this material is designed by nature to be eaten by the very organisms that create it, it possesses a characteristic that sets it apart from almost every other plastic: biodegradability.
3.1.1 Chemical Structure of PHA
To understand how PHA performs in a factory or a kitchen, we have to look at its chemical structure.
PHAs are composed of (R)-hydroxy fatty acid monomers that are linked together by ester bonds (chemical bonds that allow for the eventual breakdown of the polymer).
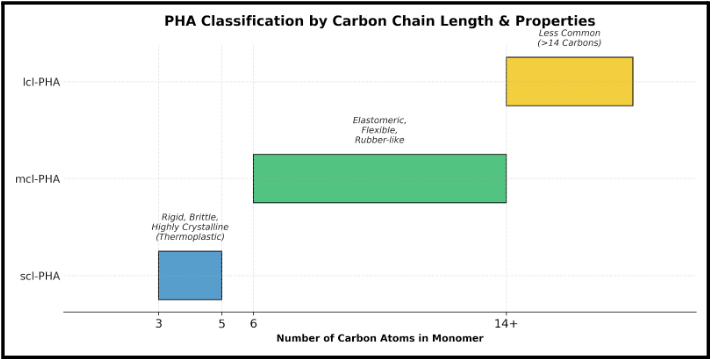
The industry classifies PHAs based on the number of carbon atoms in their monomeric building blocks. The carbon count determines whether the final plastic is stiff (for instance, as a soda bottle) or stretchy (for instance, as a rubber band).
| PHA Category | Carbon Atoms | Physical Properties | Common Examples |
|---|---|---|---|
| scl-PHA | 3–5 | Stiff, brittle, high melting point | PHB, PHBV |
| mcl-PHA | 6–14 | Elastomeric, flexible, low melting point | PHHx, PHO |
| lcl-PHA | >14 | Wax-like, specialized | Specialized copolymers |
3.1.2 How PHA is Produced
Bacteria like Cupriavidus necator are the workhorses of PHA production. However, to make PHA industrially means we need to scale these biological processes.
The Feedstock Evolution
The biggest cost in PHA production is the feed for the bacteria. Traditionally, this meant high-quality sugars like glucose or sucrose.
So, to make PHA a truly sustainable competitor to oil-based plastics, the industry is shifting toward circular feedstocks:
3.1.3 The Cost Reality
Currently, PHA is a lot more expensive than fossil-fuel plastics (sometimes up to 15 times higher). This price gap is driven by the energy required for downstream processing (breaking the bacteria open to get the plastic out) and the cost of the feedstock.
However, as the scale of production increases and we move toward waste-based feeds, these costs will decline.
3.1.4 The Superpowers of PHA
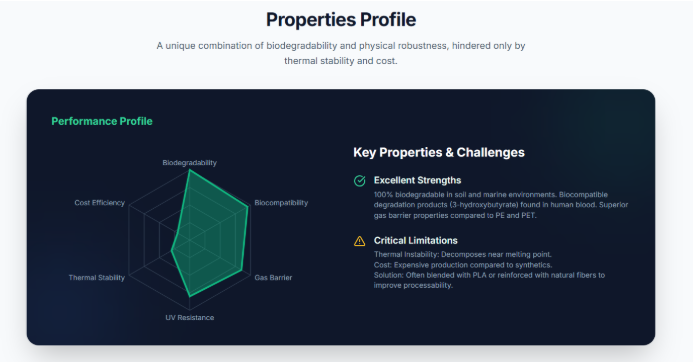
PHA offers a combination of properties that no other material can match.
True Biodegradability: Unlike degradable plastics that just break into microplastics, PHA is consumed by microbes. It disappears completely in soil, freshwater, and most importantly marine environments. If a PHA straw ends up in the ocean, it becomes fish food.
Biocompatibility: PHA is non-toxic to living tissue. In fact, when it breaks down in the human body, it produces 3-hydroxybutyrate, a substance naturally found in our blood.
High Barrier Performance: PHA is remarkably good at blocking gases. In many cases, it performs better than PE (Polyethylene) or PET (the plastic used in water bottles) at keeping oxygen out (which is vital for food shelf-life).
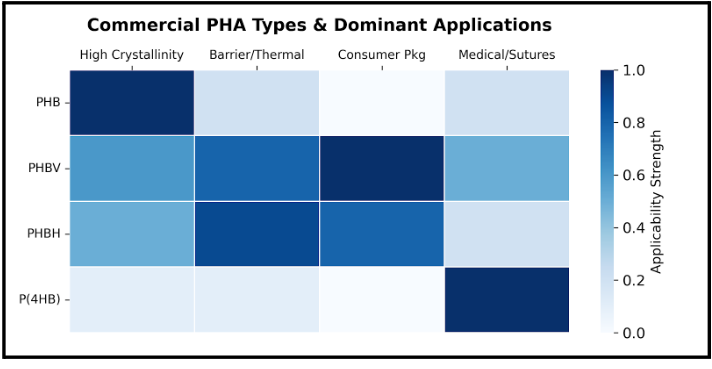
3.1.5 The Market Leaders (The Copolymers)
While pure PHB was the first PHA discovered, it is difficult to process because its melting point is very close to the temperature where it starts to burn. To fix this, the industry uses copolymers (means essentially mixing different types of PHA at a molecular level):
PHBV: Tougher and more flexible than pure PHB. Great for consumer goods.
PHBH: Offers superior heat resistance and is a strong candidate for replacing PET in bottles.
P(4HB): The gold standard for medical applications due to its high strength and slow, predictable breakdown in the body.
3.1.6 The Challenges of PHA Adoption
We believe in a grounded approach to bioplastics. PHA is not a magic bullet yet.
Aside from cost, its thermal processing window is a hurdle.
Because PHA is a biological product, it doesn’t like high heat. So if a factory worker leaves the machine running too hot for too long, the PHA can degrade inside the equipment.
To solve this, we see PHA blended with other materials or reinforced with natural fibers like wood or bamboo.
These blends make the material easier to work with while maintaining its eco-friendly credentials.
In the next section, we will break down the specific differences between PHA and other common biopolymers to see where each one wins the race for sustainability.
3.2 How PHA Differs from PLA, PBAT, and Bio-PE
The bioplastics market today is pillared on four leading materials: PHA, PLA, PBAT, and Bio-PE. Each of these materials has unique origins, chemistries, end-of-life outcomes, and market applications.
So it is essential to understand these differences to make informed choices for manufacturing, policy, and sustainability investments.
This section presents a clear, side-by-side comparison.
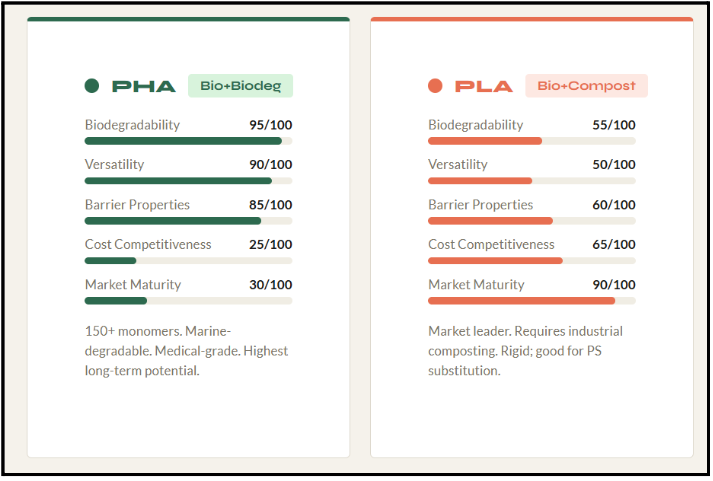
3.2.1 PHA vs. PLA (Polylactic Acid)
Polylactic Acid (PLA) is currently the most widely produced and commercially adopted bioplastic globally.
Origin and Feedstock:
PLA is bio-based, produced from renewable agricultural feedstocks such as corn starch, sugarcane, cassava, and sugar beets.
The raw material for PLA is fermented to produce lactic acid, which is then polymerised to form PLA.
Physical and Mechanical Properties:
PLA is known for its:
High rigidity
Transparency and gloss
Mechanical properties similar to polystyrene (PS) and, to some extent, polypropylene (PP)
However, PLA is naturally brittle, with a glass transition temperature between 45–60°C, and a relatively low heat resistance.
It is commonly used for:
Rigid packaging
Bottles
Thermoformed trays
3D printing filaments
Biodegradability and End-of-Life:
PLA is certified as compostable, but requires industrial composting conditions (specifically, temperatures above 58°C and regulated humidity) for effective breakdown. It does not readily degrade in soil, home compost, or marine environments. This can create confusion in end-of-life sorting and disposal.
Market Position and Cost:
PLA is the market leader in bioplastics due to its cost advantage, established manufacturing scale, and supply chain maturity.
In contrast, PHA, while also bio-based, is typically more expensive to produce(up to 15 times the cost of fossil plastics) because of complex fermentation and extraction processes.
| Feature | PHA | PLA |
|---|---|---|
| Source | Microbial fermentation | Fermentation, then polymerisation |
| Feedstock | Sugars, oils, wastes | Sugars (corn, cane, etc.) |
| Physical Form | Rigid (scl) to flexible (mcl) | Rigid, brittle |
| Heat Resistance | Moderate | Low |
| Compostability | Soil, marine, compost | Industrial compost only |
| Main Uses | Medical, packaging, agriculture | Rigid packaging, 3D printing |
| Cost | High | Moderate/low |
Key Distinctions:
PHA is structurally diverse (can be either rigid or elastomeric), while PLA is mainly rigid.
PHA biodegrades in a wide range of environments (soil, freshwater, marine, compost), while PLA requires industrial composting.
PLA dominates the market due to cost, but PHA is increasing its footprint in applications demanding true biodegradability.
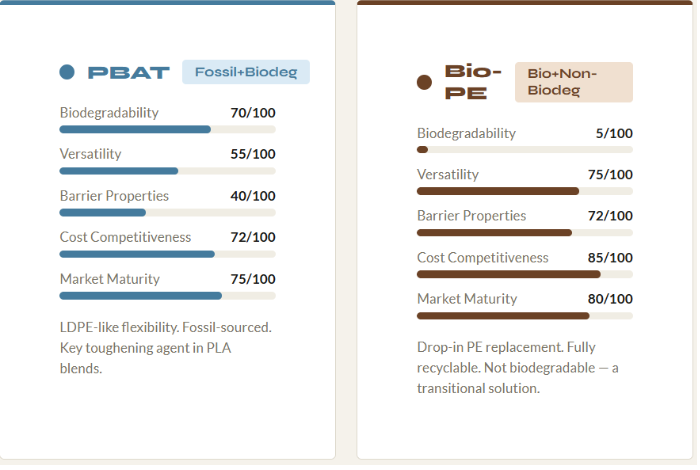
3.2.2 PHA vs. PBAT (Polybutylene Adipate Terephthalate)
Polybutylene Adipate Terephthalate (PBAT) is a fossil-based, biodegradable polyester commonly used as a flexible packaging material.
Origin and Feedstock:
PHA: Bio-based, synthesised by bacteria using renewable feedstocks.
PBAT: Synthesised from petroleum-derived monomers (1,4-butanediol, adipic acid, terephthalic acid) using standard polycondensation chemistry.
Physical and Mechanical Properties:
PHA: Highly tunable; short-chain-length types (e.g., PHB) are stiff and brittle, while medium-chain-length types are flexible, like rubber. Generally excellent oxygen and water barrier properties.
PBAT: Highly flexible and tough, with mechanical behaviour similar to low-density polyethylene (LDPE). PBAT offers good processability for films and bags but has higher water-vapour permeability and lower heat resistance than most PHAs.
Biodegradation:
PHA: Fully biodegradable in industrial compost, soil, freshwater, and marine environments. Degradation is both aerobic and anaerobic.
PBAT: Fully biodegradable in soil and industrial composting, but marine degradability is limited and not well documented.
Market Applications:
PHA: Medicine, specialty packaging (films, bottles), agriculture (mulch films).
PBAT: Rubbish bags, cling wraps, organic waste bags, disposable tableware, and as a toughening agent in PLA blends.
Comparative Table: PHA vs PBAT
| Feature | PHA | PBAT |
|---|---|---|
| Origin | Bio-based | Fossil-based |
| Synthesis | Microbial fermentation | Chemical polycondensation |
| Flexibility | Brittle to elastomeric | Highly flexible (LDPE-like) |
| Barrier | Excellent oxygen/water barrier | High water-vapour permeability |
| Degradation | Soil, marine, compost | Soil, compost |
| Uses | Medical, packaging, agriculture | Bags, wraps, blends |
Key Distinctions:
3.3.3 PHA vs. Bio-PE (Bio-polyethylene)
Bio-PE is a drop-in bioplastic—chemically identical to conventional polyethylene, but produced from renewable bio-ethanol instead of petroleum.
Origin and Feedstock:
Chemical Structure and Properties:
Biodegradability and End-of-Life:
Market Applications:
Comparative Table: PHA vs Bio-PE
| Feature | PHA | Bio-PE |
|---|---|---|
| Classification | Bio-based & biodegradable | Bio-based & non-biodegradable |
| Chemical Nature | Aliphatic polyester | Polyolefin (polyethylene) |
| Source | Microbial fermentation | Bio-ethanol from crops |
| Drop-in Solution | No (new class) | Yes (identical to fossil PE) |
| Environmental Fate | Sinks, degrades in water/soil | Persists, recycles like PE |
| Disposal | Composting, digestion | Mechanical recycling |
Key Distinctions:
| Attribute | PHA | PLA | PBAT | Bio-PE |
|---|---|---|---|---|
| Source | Bio-based (fermentation) | Bio-based (fermentation) | Fossil-based | Bio-based (bio-ethanol) |
| Biodegradability | Yes (soil, marine, compost) | Only industrial compost | Soil, compost | No |
| Key Properties | Rigid to flexible, barrier | Rigid, clear, brittle | Highly flexible | Durable, robust |
| End-of-Life | Compost, marine, soil | Industrial compost | Compost, soil | Mechanical recycling |
| Main Uses | Med, packaging, agri | Rigid packs, 3D print | Bags, wraps, blends | Bottles, bags, durable |
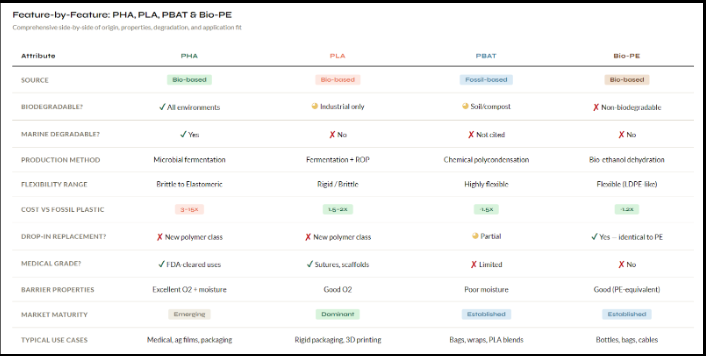
As regulatory and consumer demands change, these distinctions will play an increasingly significant role in the adoption of next-generation bioplastics.
3.3 Types of PHA
To understand the commercial potential of Polyhydroxyalkanoates (PHAs), we must first correct a common misconception: PHA is not a single material. It is a massive family of materials.
To date, scientists have discovered approximately 150 different monomers that can be combined to form PHA.
By mixing different monomers, manufacturers can create materials with a vast spectrum of characteristics, ranging from rigid, stiff plastics to flexible, rubber-like elastomers.
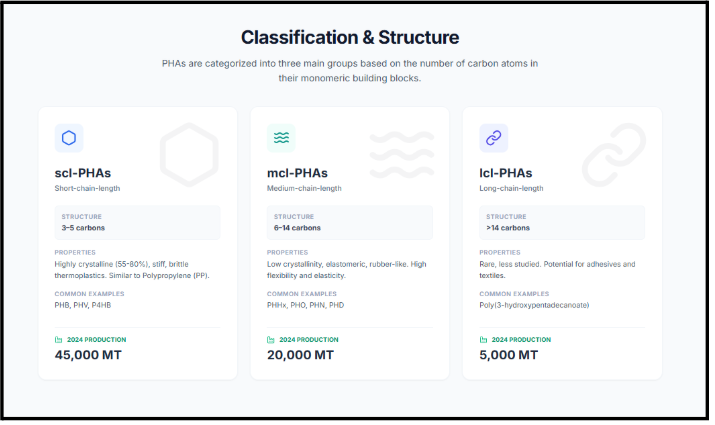
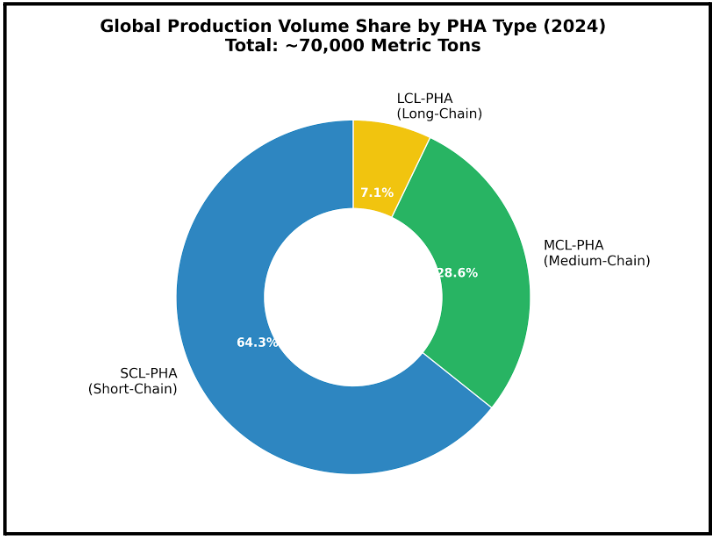
The industry classifies PHAs into three primary groups based on the number of carbon atoms in their monomeric building blocks: Short-Chain, Medium-Chain, and Long-Chain.
3.3.1 Short-Chain-Length PHAs (scl-PHAs)
The most mature segment of the market belongs to Short-Chain-Length PHAs. These are composed of monomers containing 3 to 5 carbon atoms.
Scl-PHAs currently dominate the global production landscape.
In 2024, they accounted for approximately 45,000 metric tons of global production volume. Their dominance is due to their physical properties, which mimic some of the world’s most widely used fossil-based plastics.
Properties and Performance
Scl-PHAs are characterized by high crystallinity which ranges between 55% and 80%. In polymer science, high crystallinity translates to material stiffness. Consequently, these materials act as stiff, brittle thermoplastics.
If you are looking for a bioplastic replacement for Polypropylene (PP), scl-PHAs are the closest biological equivalent.
However, their stiffness is a limitation and leads to brittleness in certain applications unless modified.
Common Examples of scl-PHAs include:
Poly(3-hydroxybutyrate) (PHB): This is the most common and extensively studied homopolymer (a polymer made of identical monomer units). It is rigid and strong, and has a high melting temperature of approximately 175–180°C. This is technically impressive. However. pure PHB has a very narrow processing window, which means it is difficult to mold without degrading the material.
Poly(4-hydroxybutyrate) (P4HB): This ia specialized variant popular for high-value medical applications such as absorbable sutures (like TephaFLEX®). That’s because it is biologically compatible and reabsorbs into the body over time.
Poly(3-hydroxyvalerate) (PHV): Another typical short-chain variety used in copolymer blends to adjust material strength.
3.3.2 Medium-Chain-Length PHAs (mcl-PHAs)
Moving up the carbon count, we find Medium-Chain-Length PHAs, which consist of monomers with 6 to 14 carbon atoms.
While smaller in volume than short-chain types (reaching about 20,000 metric tons in global production in 2024) mcl-PHAs serve a vital role in the bioplastic ecosystem.
Properties and Performance
Structurally, these materials are the opposite of their short-chain cousins. They have lower crystallinity, which makes them act as flexible, semi-crystalline elastomers or even amorphous liquids.
If scl-PHAs are the “stiff plastic” of the family, mcl-PHAs are the “rubber.”
They possess high flexibility, elasticity, and a lower melting point with higher elongation at break. This makes them ideal for applications where the material needs to bend without snapping (examples of such applications are films, coatings, soft robotics, and specialized biomedical products).
Common Examples of mcl-PHAs include:
3.3.3 Long-Chain-Length PHAs (lcl-PHAs)
The final category is Long-Chain-Length PHAs. These contain monomer units with more than 14 carbon atoms (typically 15 to 20).
This is currently a niche market. These types are seldom produced by microbes in significant quantities, So, the global production of this type of PHA was roughly 5,000 metric tons in 2024. They are significantly less studied than SCL or MCL types.
However, their unique properties (that is, being elastic and durable) have potential uses in adhesives, textiles, and specialty high-performance goods.
3.3.4 The Power of Mixing: Copolymers and Terpolymers
The real commercial value of PHA lies in Copolymers.
A copolymer is created when two different monomers are chemically bonded in the same chain. By engineering these complex structures, manufacturers can effectively canceling out the weaknesses of one monomer with the strengths of another.
The “Big Four” Commercial Types
Based on current market activity, four specific types of PHA have emerged as the most commercialized varieties worldwide.
1. PHB (The Basic Unit)
This is the widespread stiff, brittle homopolymer. While it offers strength, its brittleness and difficulty in processing limit its standalone use. It is the base upon which better materials are built.
2. PHBV (The Tougher Alternative)
Full name: Poly(3-hydroxybutyrate-co-3-hydroxyvalerate).
This is a copolymer created by adding 3-hydroxyvalerate (HV) to the basic PHB backbone. The result is a material that is harder and stronger, yet significantly more flexible and durable than pure PHB.
Typical Application: Food containers and disposable cutlery where rigidity and impact resistance are required.
3. PHBHHx (The Flexible Solution)
Full name: Poly(3-hydroxybutyrate-co-3-hydroxyhexanoate).
This copolymer combines short-chain and medium-chain units. By introducing the hexanoate unit, the material becomes soft and flexible, improving toughness and processing capabilities.
Typical Application: Packaging films and plastic bags.
4. P3HB4HB (The Medical Grade)
Full name: Poly(3-hydroxybutyrate-co-4-hydroxybutyrate).
This is a soft, elastic copolymer. Its unique biocompatibility has made it a preferred material in the medical field.
Typical Application: Drug carriers, tissue engineering, and medical implants.

Beyond copolymers, the industry is also exploring Terpolymers, such as P(3HB-co-3HV-co-3HHx). These combine three different monomers to achieve highly specific material properties that a dual-mix cannot achieve.
Summary
The landscape of PHAs is not defined by a single material, but by the ability to tune the carbon chain length to suit the application.
From the rigid, polypropylene-like performance of scl-PHAs (perfect for a shampoo bottle) to the flexible, rubber-like nature of mcl-PHAs (perfect for a produce bag), the technology offers a spectrum of solutions.
3.4 Key Performance Properties
The commercial viability of any polymer rests on its ability to perform under stress while maintaining its structural integrity during its intended shelf life.
Polyhydroxyalkanoates (PHAs) are unique because they offer a “tunable” performance profile. Because they are a family of biopolyesters rather than a single material, their properties can be adjusted by altering the microbial strain, the feedstock, or the specific monomeric composition.
The key performance properties of PHAs are:
3.4.1 Comprehensive Biodegradability and Compostability
PHAs are currently the only class of polymers that are 100% biodegradable and exclusively synthesized by microorganisms.
Aerobic Composting (Home and Industrial):
In standard composting environments, PHAs are consumed by bacteria and fungi. They convert the polymer into CO2, water, and mineral biomass. This process completes in less than four months. Unlike other bioplastics that require the aggressive heat of industrial facilities, many PHA grades are suitable for home composting.
Anaerobic Digestion (AD):
A standout feature of PHA is its ability to biodegrade in anaerobic conditions (which means environments without oxygen, such as landfill interiors or dedicated AD plants). In these settings, the degradation takes only two weeks. A strategic advantage of this pathway is that methane gas is generated in the process, which can be captured and repurposed as renewable energy.
3.4.2 Marine and Aquatic Degradation
One of the most significant environmental arguments for PHA is its “Marine-Degradable” certification. While most plastics fragment into microplastics when they enter the ocean, PHA serves as a carbon source for marine microbes.
Density and “The Sinking Effect”:
Most conventional plastics (like Polyethylene) have a lower density than water. This causes them to float on the surface and travel vast distances. PHAs possess a higher density than water. This means they sink to the bottom of aquatic ecosystems.
Ukhi explains: The “sinking” nature of PHA is a misunderstood benefit. In a circular economy, we want materials to stay within managed waste streams. However, if a leak occurs, a material that sinks and degrades in sediment is infinitely better than one that floats and enters the digestive systems of surface-feeding marine life.
Benthic Biodegradation:
By sinking into the sediment (the benthic zone), PHA enters an area rich in microbial activity. This means biodegradation can carry on even in the oxygen-poor environments of the sea floor.
Degradation Timeline:
Natural degradation in cold seawater can be a slow process taking several years. Still, it is significantly accelerated by exposure to Ultraviolet (UV) light near the surface. This dual-action (biological consumption and UV-assisted breakdown) ensures that PHA does not contribute to the permanent “Pacific Garbage Patch” phenomenon.
3.4.3 Barrier Properties
For the packaging industry, a material is only as good as its barrier performance. If it fails to block oxygen or moisture, the product it is supposed to protect, will get spoilt. PHA excels in this area and outperforms traditional fossil-fuel plastics.
Gas and Moisture Resistance
PHAs are naturally hydrophobic (water-repellent) and insoluble in water. This chemical nature means PHAs offer a superior moisture barrier compared to Polypropylene (PP). Furthermore, PHA’s oxygen barrier properties are superior to both Polyethylene (PE) and PET (the material used for soda bottles).
PHA is naturally resistant to UV radiation. This is a critical functional property for food and cosmetic packaging, as it prevents light from degrading the sensitive oils or nutrients inside the package.
Performance Enhancement (Nanofillers): For ultra-high-performance requirements, PHA can be compounded with nanofillers such as nanoclay or graphene oxide. These additives create what is known as a “tortuous pathway”. Think of it as a microscopic maze that makes it physically difficult for gas molecules to pass through the material. This extends the shelf life of the product.
| Property | PHA Performance | Comparison to Conventional Plastics |
|---|---|---|
| Oxygen Barrier | Excellent | Superior to PE and PET |
| Water Vapor Barrier | High | Better than PP |
| UV Stability | High | Superior to many untreated polyolefins |
| Water Solubility | Insoluble | Hydrophobic (water-repellent) |
3.4.4 Heat Resistance and Thermal Stability
The thermal profile of PHA determines how it can be manufactured and which “real world” temperatures it can withstand (such as being left in a hot car or holding hot coffee).
Temperature Tolerance:
PHAs generally exhibit good resistance to heat, with some forms remaining stable up to 120°C. Their melting points (Tm) typically fall between 160°C and 180°C, placing them in the same functional category as PVC and PET.
The Processing Window:
A significant hurdle for manufacturers is the narrow “thermal processing window.” For many PHAs (especially the homopolymer PHB), the temperature at which the plastic melts is dangerously close to the temperature at which it begins to thermally degrade (approximately 200°C). If the material is overheated during production, it loses its structural strength.
The Copolymer Solution:
To overcome this, manufacturers utilize copolymers like PHBV or 4-hydroxybutyrate. These additions lower the melting point, which widens the gap between “melt” and “degrade.” This broader thermomechanical range allows for easier processing on standard industrial machinery.
The combination of high barrier performance and universal biodegradability positions PHA as a premium material. However, these technical strengths must be weighed against its higher production cost.
3.5 Commercial Positioning of PHA
PHA stands out because it is both highly versatile and truly biodegradable. Unlike many “green” plastics that only break down in industrial composters, PHA will naturally biodegrade in regular soil and even in marine environments. It does this without leaving behind microplastics or toxic residues, which sets it apart from most alternatives.
Today, PHAs make up a small part (about 3.9%)of the total bioplastics market. This is far less than more established materials like polylactic acid (PLA). But this share is expected to rise quickly. In fact, industry forecasts predict PHA production capacity will grow by 57% by 2028.
PHA is not yet a commodity, but it can soon be one.
3.5.1 Competitive Positioning vs. Fossil-Based Plastics
The ultimate goal for any bioplastic is to replace fossil-based plastics like polypropylene (PP) and low-density polyethylene (LDPE), which are found in everything from packaging to car parts.
PHA isn’t taking on these plastics everywhere at once. Instead, its entry point is in smaller, higher-value sectors where its unique strengths matter most.
While everyone looks at packaging films, research suggests that PHA’s most immediate strategic win lies in a different sector: Polyurethane (PUR) sealants and adhesives.
In these applications, the economics and environmental mathematics shift in favor of biology. PHA derived from urban biowaste can already outperform fossil-based PUR. The impact is measurable:
Environmental Impact: Four times lower than fossil PUR.
Societal Costs: Eight times lower.
This positions PHA not just as a “green alternative” but as a superior socioeconomic choice in the construction and automotive sealant markets.
Of course, the larger prize is the mass market of commodity films (LDPE) (the material used in everything from shrink wrap to grocery bags).
At the moment, high production costs mean PHA is not price-competitive for these uses.
The industry acknowledges this gap. However, the roadmap to closing this gap is clear.
The industry is positioning PHA to enter this space as biorefinery efficiencies improve, specifically, by reducing the reliance on expensive chemical extraction agents like sodium hypochlorite.
So, as these processing costs drop, PHA could move from a premium niche to a viable mass-market competitor.
3.5.2 How PHA Differs from Other Bioplastics
It’s not just fossil plastics that PHA is up against; it also needs to stand out among other bioplastics.
Most bioplastics, like PLA, need special industrial composting to break down. If a PLA item ends up in the ocean or in a ditch, it could last for decades. PHA, on the other hand, will break down in freshwater, saltwater, and soil. This is a big selling point for applications where there is a real risk of litter or environmental leakage.
Some bioplastics get soggy or fall apart when exposed to high humidity. PHA is much more stable in wet conditions. That makes it useful for packaging sensitive electronics, for example, where moisture would be a disaster.
PHA is not always a substitute; sometimes it’s an enhancer. Manufacturers sometimes blend PHA with PLA to make the resulting plastic stronger, tougher, or softer.
3.5.3 Main Market Segments for PHA
PHA’s physical properties are highly tunable, which means it can be made to be stiff and strong, or soft and flexible. That opens up different types of markets.
Packaging
This is currently the largest volume use for PHA. The application list is familiar to any consumer:
Food containers
Single-use cups
Compostable bags
Rigid packaging
Here, the “premium” positioning appeals to brands that want to make a sustainability statement beyond simple recycling.
Medical (The High-Value Niche)
This is where the high cost of PHA is less of a barrier. Due to its biocompatibility (the body accepts it without rejection), PHA is positioned for high-margin medical applications.
In this segment, the material is positioned as a life-science product.
Agriculture (The Functional Segment)
This is the most practical positioning of the material. PHA is used for mulch films and seed coatings.
The value proposition here is labor-saving. Because PHA can be left to degrade naturally in the soil, farmers eliminate the need for the retrieval and disposal of plastic films after the harvest. The plastic becomes part of the soil.
So, in this context, PHA is positioned as an operational efficiency tool as much as an environmental one.
3.5.4 Market Challenges and Restraints
Despite these strengths, there are important reasons why PHA hasn’t taken over the plastics world yet.
The number one barrier is price. PHA is much more expensive to make than regular plastics, mainly because the fermentation process is complex, the raw materials (like sugars and oils) are costly, and yields are lower.
Making PHA in the lab or in small pilot plants is one thing. Scaling up to big, efficient factories is much harder. It’s only when PHA is produced at industrial scale that costs will fall enough to take on mainstream markets.
Many buyers still don’t understand the difference between biodegradable, compostable, and bio-based plastics. This makes it harder for PHA to differentiate itself based on its real strengths.
For now, PHA mostly fits in markets where buyers are willing to pay extra for performance or for a clear sustainability benefit, such as in high-end packaging, the medical sector, or for agricultural films in places with strict environmental rules.
Summary
In summary, PHA is currently positioned as the “Gold Standard” of bioplastics. It is technically superior in its end-of-life profile and versatile in its application, but constrained by the economics of early-stage scaling.
4. Global PHA Market Size & Growth (2018–2030)
Polyhydroxyalkanoates (PHAs) are still a small part of the global plastics industry. However, they are growing quickly and attracting serious attention from investors, manufacturers, and policymakers.
As of 2024, PHAs account for roughly 1.2% to 4.1% of total global bioplastics production capacity. This is modest when compared to more established materials like PLA. But PHA is widely regarded as one of the most important long-term materials in the sector because of one key advantage: it can fully biodegrade in soil, freshwater, and marine environments.
This section outlines where the global PHA market stands today, how it has grown, and what the next five to ten years may look like.
4.1 Global Market Size and Capacity
Current Production Levels
The PHA industry has expanded steadily over the past five years.
This shows that PHA is moving beyond laboratory and pilot scale. It is now entering structured industrial production.
Market Value
Market value estimates vary widely depending on methodology and what products are included.
In 2023, reported market values ranged from USD 93.55 million to USD 650.7 million.
One 2024 estimate placed the global PHA market at USD 714.7 million.
This variation reflects the still-developing nature of the sector and differences in how analysts define the market.
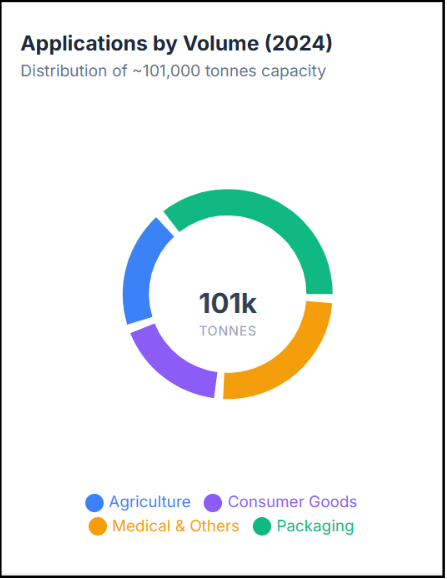
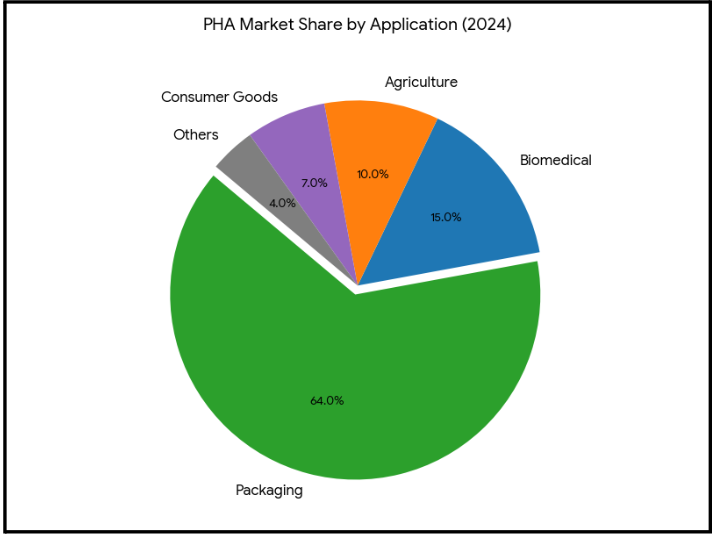
Where PHA Is Used (2024 Volume Split)
Based on available capacity data:
Packaging: ~38,000 tonnes
Agriculture: ~19,000 tonnes
Consumer goods: ~18,000 tonnes
Medical: ~5,000 tonnes
Packaging is clearly the largest segment by volume.
Growth Projections and Future Capacity
PHA is expected to grow faster than most other biopolymers over the coming years.
Capacity Expansion
Some projections suggest PHA could reach 17% of total bioplastics capacity by 2029, equivalent to roughly 974,000 tonnes.
Many sources forecast a 57% global capacity increase by 2028.
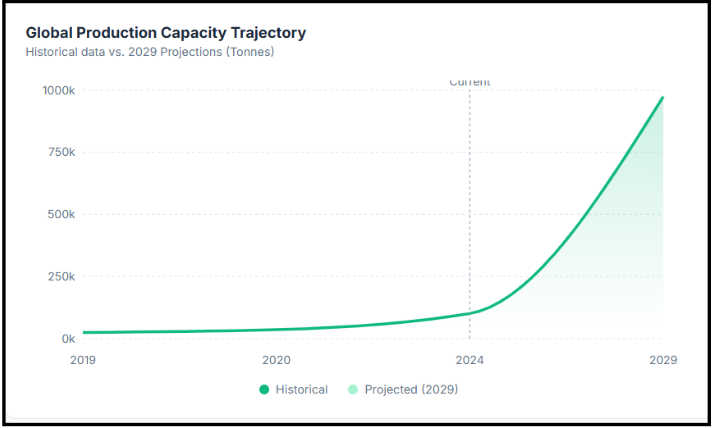
If these projections hold, PHA will move from a niche material to a major part of the bioplastics landscape.
CAGR Estimates
Reported compound annual growth rates (CAGR) vary but remain strong:
By 2030, the PHA market is projected to reach approximately USD 1.22 billion.
4.2 Regional Market Dynamics
Europe
North America
Asia-Pacific
4.3 Core Growth Drivers
Several factors are pushing PHA forward.
1. Environmental Regulation
More than 50 countries now have restrictions or bans on single-use plastics. Regulations increasingly favour certified biodegradable materials.
2. Feedstock Innovation
Producers are shifting toward lower-cost feedstocks such as urban food waste, sewage sludge, and even carbon dioxide. This reduces costs and aligns with circular economy goals.
3. High-Value Applications
Medical uses—such as absorbable sutures and implants—accounted for roughly 5,000 tonnes in 2024. These premium applications support industry profitability while scale builds elsewhere.
4. Marine and Soil Biodegradability
PHA’s ability to biodegrade in natural environments directly addresses concerns about ocean plastic and microplastic pollution.
4.4 Key Barriers
Despite strong growth, significant challenges remain.
1. Cost and Scale
In 2024, PHA was still 3–4 times more expensive than conventional plastics like polypropylene.
Only around 120 companies globally operate at commercial scale.
2. Downstream Processing
Extraction and purification steps account for 30–50% of total production costs.
Improving efficiency in this stage is critical for price reduction.
Technology Shifts
The industry is transitioning toward Next Generation Industrial Biotechnology (NGIB).
This includes:
If these technologies scale successfully, PHA could become cost-competitive with fossil plastics within the decade.
Key Takeaways
5. PHA Country-Level Market Profiles
5.1 China
China has firmly established itself as a global powerhouse in the bioplastics sector.
While the country produces a wide range of biodegradable materials like PLA and PBAT, Polyhydroxyalkanoates (PHA) occupy a special strategic position.
In China, PHA is widely regarded as the “bioplastic of the future.”
The industry here has successfully moved PHA from the laboratory to the factory floor. Manufacturers use agricultural crops (specifically corn starch) as the raw material for fermentation. This creates a strong link between China’s massive agricultural output and its industrial ambition for PHA.
However, the market presents a distinct paradox: China is a manufacturing giant with immense capacity, yet its domestic consumption of these high-value materials is not enough.
China – PHA Market at a Glance
| Metric | Status / Data Point |
|---|---|
| Share of global biodegradable plastics capacity | ~20% |
| Total plastics output (all plastics, 2022) | 128 million tonnes (32% of global output) |
| Biodegradable plastics volume | ~162,000 tonnes |
| Bioplastics market value | ~USD 1.6 billion (2024) |
| Share of global bioplastics value | ~4.8% |
| Forecast CAGR (2023–2026) | ~49% |
| Forecast CAGR (to 2030) | ~23.44% |
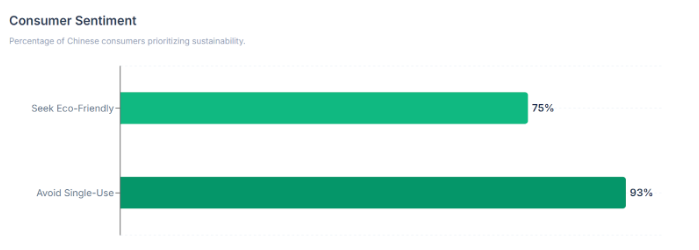
| Consumer sentiment | 93% seek fewer single-use plastics; 75% prioritize eco-friendly products |
| Core feedstock for PHA | Corn starch |
| R&D support allocation | >1.2 billion RMB |
| Key policy drivers | 2020 Plastic Ban; 14th Five-Year Plan (2021); Three-Year Action Plan (2023); Dual Carbon targets |
5.1.1 Current PHA Market Size and Global Share For China
When we analyze the production numbers, China’s dominance purely in terms of volume is undeniable.
The country accounts for approximately 20% of the global production capacity for biodegradable plastics.
To put the scale of the broader industry in perspective, here’s a fact: China’s total plastics output reached 128 million tonnes in 2022, which represents 32% of the global market.
Within this vast ecosystem, the biodegradable sector is scaling rapidly.
As of recent assessments:
Volume: The market volume for biodegradable plastics in China was recorded at 162,000 tons.
Value: The overall Chinese bioplastics market (aggregating PHA, PLA, and PBAT) was valued at approximately USD 1.6 billion in 2024.
Despite this manufacturing muscle, China’s capture of global value is lower than one might expect. The domestic bioplastics market represents only about 4.8% of the global market share by value. This significantly trails the United States (35%) and Europe (31%).
This indicates that while China is building the infrastructure to supply the world, its internal market for premium materials like PHA is still in the early stages of maturity compared to the West.
5.1.2 Growth Rate and Market Trajectory for PHA in China
The trajectory of the Chinese PHA market is aggressive.
Forecasts for the near future are incredibly bullish.
The sector is expected to grow at a Compound Annual Growth Rate (CAGR) of 49% between 2023 and 2026.
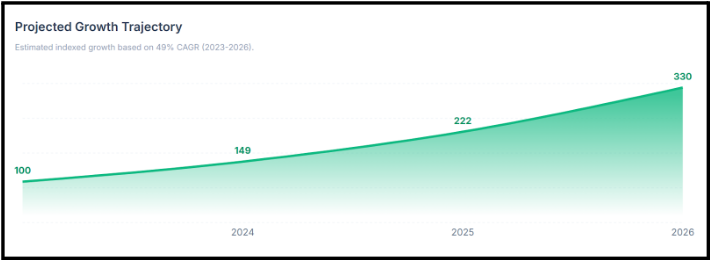
Even looking at the longer term, conservative estimates project a steady CAGR of 23.44% through 2030.
Two primary engines are driving this expansion:
The demand for flexible packaging in China’s massive logistics and delivery sector is immense.
Public sentiment is turning against pollution. Recent surveys indicate that roughly 93% of Chinese consumers actively seek to buy fewer single-use plastics. Furthermore, 75% are expected to prioritize eco-friendly products in the future.
5.1.3 Market and Policy Evolution for PHA in China
The rise of PHA in China is the result of deliberate, long-term policy engineering.
While PHA was discovered globally in the 1970s, its industrialization in China began in earnest in the early 21st century. The state’s involvement has been the catalyst for this shift, anchored in the “Dual Carbon” framework, which is China’s commitment to peak carbon emissions by 2030 and achieve carbon neutrality by 2060.
Because 76% of China’s petrochemical feedstock is imported oil, developing a bio-based industry is a matter of national energy security as much as environmental protection.
The regulatory landscape has evolved through distinct phases:
2008: Early bans on ultra-thin plastic bags set the initial groundwork.
2020 Plastic Ban: This was a landmark policy phasing out non-biodegradable single-use plastics (cutlery, straws, bags) in the catering industry. Crucially, it created a specific regulatory “carve-out” that permits certified biodegradable alternatives. This effectively illegalized the competition (cheap plastic) and created a guaranteed market for materials like PHA.
14th Five-Year Plan for the Bioeconomy (2021): This elevated biotechnology to a national strategic force.
Three-Year Action Plan (2023): A roadmap aiming to make non-food bio-based products competitive with fossil-based counterparts by 2050.
To back these policies, the government has allocated over 1.2 billion RMB specifically to support bioplastics R&D.
5.1.4 Trends in Adoption and Consumer Preferences for PHA in China
Despite strong policy support, the PHA market faces a harsh reality: price.
In general, bioplastics in China are estimated to be 35% more expensive than conventional plastics. For PHA specifically, the cost premium is even higher due to the complexity of fermentation. This has left the market not fully ready for widespread adoption.
However, adoption of PHA is occurring in specific high-value niches where the costs can be justified:
The consensus is that as production scales and costs drop, the “willingness to pay” will align with the “ability to pay.”
5.1.5 Unique Trends, Real-World Examples, and Challenges for PHA in China
A unique characteristic of the Chinese PHA sector is the origin of its innovation. Unlike in the West, where innovation stems from corporate R&D, Chinese innovation is frequently driven by university spin-offs.
Key Market Players and Innovation
PhaBuilder: Founded in 2021 by Professor Chen Guoqiang of Tsinghua University, this company is a prime example of academic research scaling into commercial production.
Bluepha: A synthetic biotech firm operating a highly automated R&D lab in Shanghai. They specialize in molecular innovation to develop 100% biodegradable PHAs through fast iterations.
BBCA PHBV & Kingfa Science & Technology: These are major corporate players integrating PHA into broader biodegradable product lines.
Challenges and Risks
We must conclude the profile with a grounded look at the hurdles facing this market:
Scalability: Scaling from a lab beaker to a 10,000-liter tank without losing yield remains a difficult engineering challenge.
Feedstock Competition: Manufacturing currently relies heavily on agricultural crops (corn starch). This creates a tension between industrial growth and food security
The Innovation Gap: Although China is a volume leader, it still trails in intellectual property. The U.S. holds 36% of global bioplastic patents, compared to China’s 19.5%.
Lack of Standards: While bans on fossil plastics exist, there is a lack of specific regulations designed to create a dedicated market for biobased polymers. This makes it difficult for premium PHA to compete against cheaper, “technically biodegradable” alternatives like PLA that do not offer the same environmental benefits.
5.2 India
India is building its bioplastics industry on something it already has in abundance: agricultural by-products.
Materials such as sugarcane molasses and bagasse are being converted into higher-value polymers through fermentation. This approach supports a “waste-to-value” model. It addresses two challenges at once:
By linking agriculture, biotechnology, and manufacturing, India is shaping a bioplastics ecosystem that is both industrial and regenerative.
India – PHA Market at a Glance
| Metric | Status / Data Point |
|---|---|
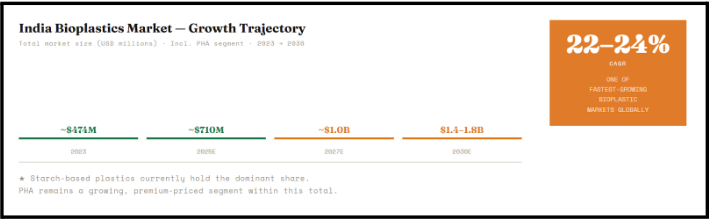
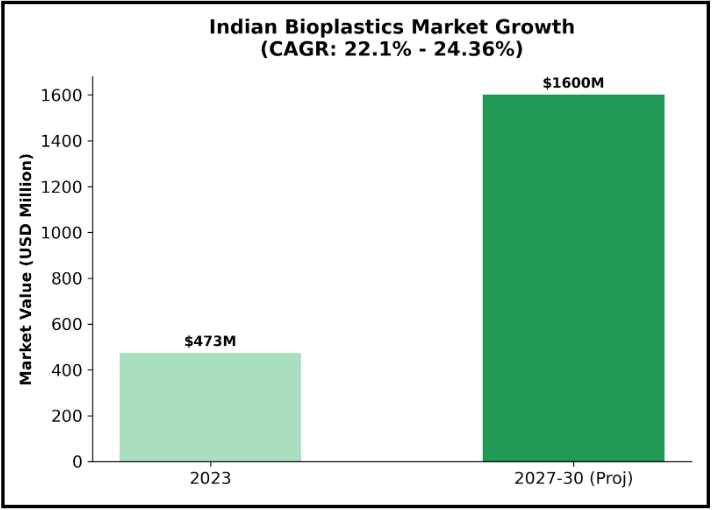
| Bioplastics market value (2023) | ~USD 447–500 million |
| Projected market value (2030) | ~USD 1.4–1.8 billion |
| Growth rate (CAGR) | 22.1%–24.4% |
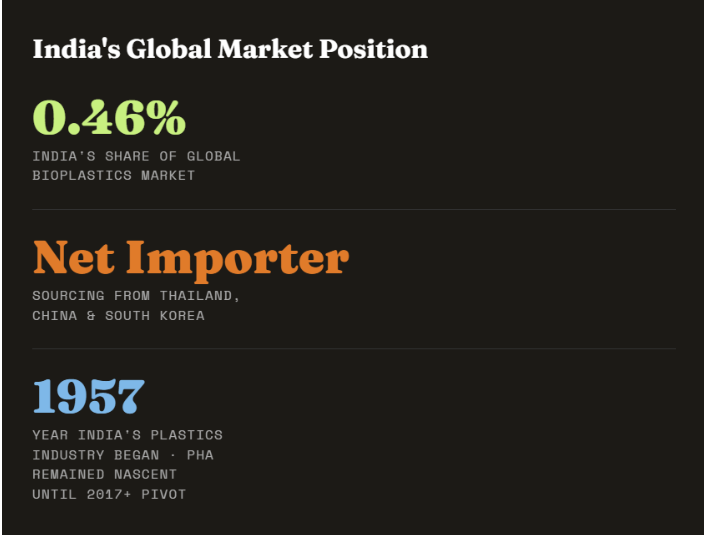
| Global market share | ~0.46% of global bioplastics industry |
| Import dependency | Historically high (Thailand, China, South Korea) |
| Key feedstocks | Sugarcane molasses, bagasse, agri side-streams |
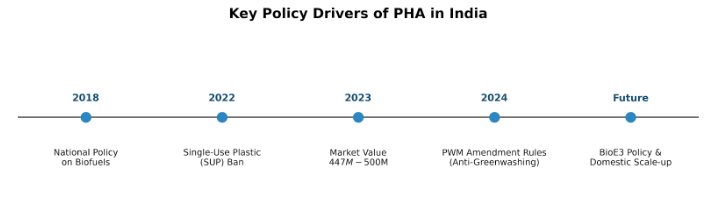
| Major policy drivers | 2022 SUP Ban; BioE3 Policy; PWM Rules 2024 |
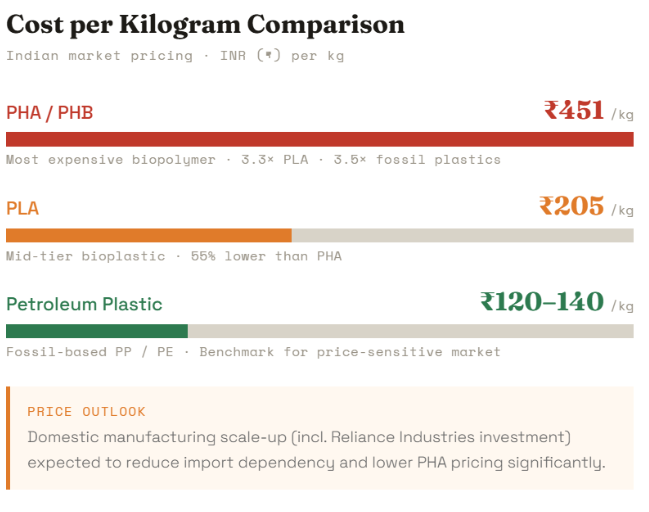
| PHA price vs alternatives | PHA: ~₹451/kg; PLA: ~₹205/kg; Fossil plastics: ~₹130/kg |
| Core application segments | Packaging, agriculture (mulch films), medical |
| Primary challenges | High cost; narrow processing window; scale-up complexity |
In India, Polyhydroxyalkanoates (PHA), and particularly the type known as Polyhydroxybutyrate (PHB), are moving from research to commercial value chains.
PHAs are produced through microbial fermentation of renewable biomass.
While lower-cost starch blends currently dominate India’s biodegradable plastics market, PHA is finding its role in applications where biodegradability must be reliable.
5.2.1 Current PHA Market Size and Global Share For India
However, this dynamic is changing.
New domestic manufacturing capacity is coming online. As India scales local production of PLA and PBAT, it strengthens the broader infrastructure needed for PHA fermentation as well.
5.2.2 Growth Rate and Market Trajectory for PHA in India
India’s projected growth rate for the PHA market (above 22% CAGR) is among the highest globally.
For PHA specifically, growth is tied to:
5.2.3 Market and Policy Evolution for PHA in India
Policy has played a decisive role in accelerating India’s biodegradable plastics sector.
1. The 2022 Single-Use Plastic (SUP) Ban
The nationwide ban on 21 low-utility plastic categories created immediate demand for alternatives. This policy created a real market opportunity for certified biodegradable materials.
2. BioE3 Policy
The Biotechnology for Economy, Environment and Employment (BioE3) policy identifies biopolymers as a strategic sector. It promotes the development of bio-manufacturing hubs to support industrial-scale fermentation.
3. Plastic Waste Management (Amendment) Rules, 2024
These rules tightened the definition of “biodegradable plastic.”
This regulatory shift benefits materials like PHA, which are naturally biodegradable across soil and water environments.
5.2.4 Trends in Adoption and Market Preference for PHA in India
Adoption in India are chosen where PHA provides functional value.
Packaging
PHA is being used in food containers and liquid-contact packaging because of its high hydrolysis resistance. This means it does not break down prematurely when exposed to moisture.
Agriculture
Farmers are beginning to adopt PHA mulch films and seedling trays. These can be ploughed back into the soil after use. This eliminates the labour and cost of collecting conventional plastic films from fields. This benefit is operational as much as environmental.
Medical
PHA’s biocompatibility makes it suitable for absorbable sutures and drug delivery systems. In this segment, performance outweighs price sensitivity.
Consumer Sentiment
Surveys indicate that approximately 93% of Indian consumers want to reduce single-use plastic consumption. This consumer preference pushes brands to consider certified biodegradable options.
5.2.5 Unique Trends, Real-World Examples, and Challenges for PHA in India
India’s strength in PHA lies in feedstock diversity and research depth.
Waste-Based Feedstocks
Indian research institutions are exploring non-traditional carbon sources, including:
This reduces reliance on food-grade sugars and improves long-term feedstock security.
Institutional Research
Challenges
Despite strong momentum, there are real barriers.
1. Price
PHA remains the most expensive commonly discussed biopolymer in India.
This cost gap limits PHA primarily to applications where environmental performance or functional benefit justifies the premium.
2. Processing Complexity
PHA has a narrow processing window. It melts at around 175°C but begins degrading near 185°C.
This requires precise temperature control and skilled manufacturing practices. Without technical discipline, yield losses increase.
Ukhi Perspective
From Ukhi’s standpoint, India’s long-term advantage lies in feedstock security and decentralised agricultural inputs.
Unlike countries dependent on imported biomass, India has large volumes of sugar residues and agricultural side-streams available domestically. This reduces supply chain risk.
For industrial players—including companies like Ukhi working at the intersection of material science and agricultural value chains—the opportunity is not limited to replacing plastic.
It is about building a domestic bio-materials ecosystem.
5.3 Thailand
Thailand has built a strong position in the global bioplastics industry. Polyhydroxyalkanoates (PHA) are seen as a key material for the country’s long-term strategy.
Thailand’s national development framework(the Bio-Circular-Green (BCG) Economy Model) treats biological resources as a strategic asset.
The country’s large agricultural base, particularly sugarcane and cassava, provides the raw materials needed for fermentation-based plastics.
This combination of policy direction and feedstock availability has created a foundation for growth.

| Metric | Status / Data Point |
|---|---|
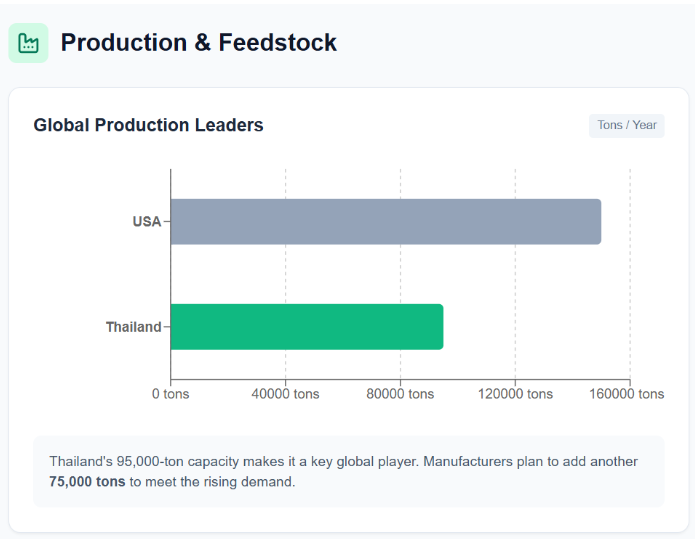
| Total bioplastics capacity | ~95,000 tons/year |
| PHA share of global bioplastics | ~3.9% (2022) |
| Export share | ~90% of production exported |
| Export growth (2017–2022) | 25% CAGR (value); 23% CAGR (volume) |
| Capacity expansion plans | +75,000 tons/year planned |
| National target | Bio Hub of ASEAN by 2027 |
| Fiscal incentives | 125% tax deduction; up to 8-year BOI tax exemption |
| Main feedstocks | Sugarcane, cassava, palm oil mill effluent (POME) |
| PHA resin price | ~US$7/kg |
| Core challenges | High energy intensity; limited composting infrastructure; feedstock volatility; agricultural impacts |
5.3.1 Current PHA Market Size and Global Share For Thailand
- Thailand is currently the second-largest producer of bioplastics in Asia.
- Total bioplastics production capacity is approximately 95,000 tons per year.
This export orientation is significant. In fact, Thailand’s bioplastics industry has grown largely by serving international demand rather than domestic consumption.
For PHA specifically, Thailand is positioning itself not as a niche experimental producer, but as an industrial supplier.
5.3.2 Growth Rate and Market Trajectory for PHA in Thailand
Thailand’s bioplastics industry has grown steadily over the past decade, driven by both policy and global demand.
Between 2017 and 2022:
The government has set a clear goal: to become the Bio Hub of ASEAN by 2027.
PHA is expected to benefit from this push. Among bio-based resins, PHA is projected to experience one of the fastest increases in demand globally.
To support future growth:
These developments suggest that Thailand’s approach is capacity-driven and export-focused.
5.3.3 Market and Policy Evolution for PHA in Thailand
Thailand’s focus on bioplastics began formally in 2008 with the National Roadmap for the Development of the Bioplastics Industry. This roadmap allocated $60 million to establish early infrastructure and position Thailand as a regional leader.
Since then, policy support has remained consistent.
Bio-Circular-Green (BCG) Economy Model
The BCG model treats biological resources as economic drivers. Bioplastics, including PHA, are identified as priority sectors. The objective is to convert agricultural output into higher-value materials rather than exporting raw crops.
Fiscal Incentives
The government offers strong financial incentives to encourage production and adoption:
Waste Policy and Standards
Thailand’s Plastics Waste Management Roadmap (2018–2030) includes bans on single-use plastics and polystyrene foam. This creates demand for alternatives.
In 2024, the Thai Industrial Standards Institute (TISI) adopted ISO 22526-4, an international standard for life cycle assessment (LCA) of biobased plastics. This improves transparency around environmental impact and reduces greenwashing risks.
5.3.4 Trends in Adoption and Consumer Preferences for PHA in Thailand
Most PHA produced in Thailand is used to meet export demand, especially in regions with strict environmental regulations.
However, domestic adoption is gradually increasing.
Pricing remains a constraint.
Consumer surveys indicate:
5.3.5 Unique Trends, Real-World Examples, and Challenges for PHA in Thailand
Feedstock Advantage
Thailand’s agricultural base is central to its PHA strategy.
Key feedstocks include:
Glucose derived from sugarcane is particularly efficient because it requires minimal additional processing before fermentation. This reduces both cost and energy use.
Research has shown that converting cassava into bioplastics can increase its economic value by up to ten times. This creates direct rural economic impact.
Microbial Research
Thai scientists have identified effective PHA-producing bacterial strains, including:
A mutant strain of Bacillus licheniformis has shown strong yields when using POME as a substrate.
This demonstrates a practical approach: using industrial waste streams as carbon sources.
Industrial Partnerships
The partnership between RWDC Industries and Lummus Technology represents a move toward scaling PHA production at commercial levels.
Meanwhile, companies such as Total Energies Corbion (PLA) and PTT MCC Biochem (PBS) operate alongside newer entrants focusing on PHA.
Thailand’s ecosystem includes both established players and emerging fermentation specialists.
Biofuel Exploration
Beyond plastics, Thai researchers are exploring PHA derivatives such as 3HBME and 3HAME as gasoline additives. Early testing suggests performance similar to ethanol, with lower corrosiveness.
While still in development, this reflects the broader versatility of PHA chemistry.
Environmental and Infrastructure Challenges
Despite strong policy support, there are material challenges.
Energy and Emissions
Current PHA production in Thailand can result in higher cradle-to-gate greenhouse gas emissions than petrochemical plastics and even PLA. This is largely due to energy-intensive conversion processes.
Agricultural Impact
Large-scale cultivation of sugarcane and cassava carries environmental risks:
These trade-offs must be managed carefully.
Waste Management Infrastructure
Thailand lacks widespread industrial composting infrastructure.
If biodegradable plastics enter landfills, they may decompose anaerobically and release methane, which has a higher warming impact than CO₂.
Additionally:
Climate Risk
Feedstock crops are weather-dependent. Events such as droughts and El Niño can disrupt supply and increase raw material prices.
Conclusion
Thailand has built one of Asia’s most structured and policy-supported bioplastics industries. Its strategy combines:
At the same time, the country faces real environmental and infrastructure constraints. Energy use, agricultural impacts, and composting gaps must be addressed for PHA to scale sustainably.
5.4 USA
In the U.S., PHAs are valued as a biological technology.
Unlike conventional plastics, which are produced through petrochemical refining, PHAs are made through controlled fermentation processes using microorganisms.
The American market is currently defined by how these bacteria are fed, with the industry moving through three distinct “generations” of feedstock:
The market for bioplastics (and PHA) is characterized by high costs and a complex regulatory fight between federal and state-governments.
USA – PHA Market at a Glance
| Metric | Status / Data Point |
|---|---|
| North America share of global bioplastics capacity | ~19% (≈420,000 tonnes) |
| Share of bio-based resins in total U.S. plastics production | ~0.71% |
| U.S. bioplastics industry revenue | ~$96.75 million (2025 estimate) |
| Global PHA output benchmark | Expected to surpass 50,000 tonnes by 2025 (though reputed market research suggests the actual number may be much smaller) |
| Investment inflow | $500+ million (venture capital + government funding) |
| Projected CAGR (range) | 6.53% (conservative) to 15.3% (optimistic) |
| Projected market value | ~$167–171 million by 2027–2034 (varies by estimate) |
| Dominant application segment | Packaging (~64% of film revenues) |
| Fastest-growing segment | Biomedical and healthcare |
| Core challenges | High cost; fragmented regulation; composting infrastructure gaps; processing complexity |
5.4.1 Current PHA Market Size and Global Share For USA
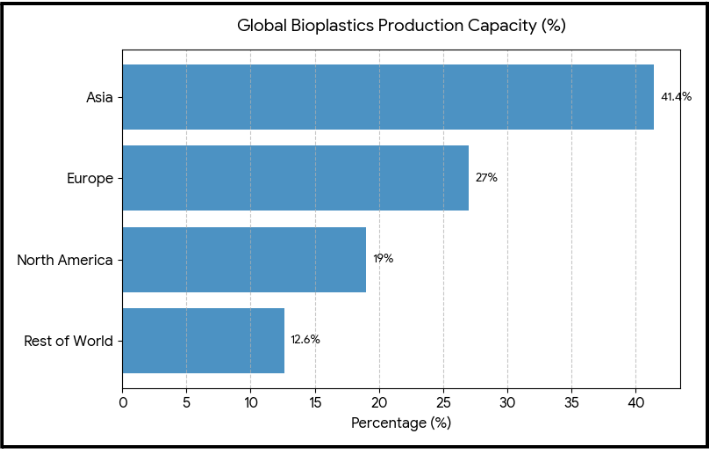
North America currently accounts for approximately 19% of total global production (about 420,000 tonnes), trailing Asia (41.4%) and Europe (~27%).
However, when we zoom in on bio-based resins specifically within the massive U.S. plastics sector, the share is minute.
Bio-based resin production represents an estimated 0.71% of overall U.S. plastic resin production.
Financially, the broader U.S. bioplastics manufacturing industry revenue was estimated at 96.75 million in 2025.
5.4.2 Growth Rate and Market Trajectory for PHA in USA
Despite the small current footprint, the trajectory of growth for PHA is aggressive. The U.S. market is capitalizing on a surge of investment, in the backdrop of the global PHA output being expected to have surpassed 50,000 tonnes by 2025 (expected to surpass 50,000 tonnes by 2025 (though reputed market research suggests the actual number may be much smaller).
This expansion is supported by over $500 million in venture capital and government funding flowing into the sector.
Growth projections vary, but all point upward:
The growth is not uniform across all sectors.
While packaging remains the dominant revenue stream (accounting for over 64% of film revenues), the biomedical and healthcare sectors are the fastest-growing.
Here, the high cost of PHA is less of a barrier compared to its value in tissue engineering and drug delivery.
5.4.3 Market and Policy Evolution for PHA in USA
In the U.S., PHA was first documented in 1925, and initial commercialization attempts in the 1970s and 90s were largely halted by economic factors. The last decade has seen a revival, driven largely by a shift in federal policy.
The “Whole-of-Government” Push
The current landscape is shaped by Executive Order 14081, signed in 2022. This ambitious order set a national goal to replace 90% of conventional plastics with bio-based alternatives within 20 years.
Ukhi explains:
The Executive Order 14081 has now been rescinded under the current administration:
This means EO 14081 is no longer in effect and its directives are no longer driving federal bioeconomy policy.
To support this, the USDA BioPreferred Program mandates that federal agencies give procurement preference to bio-based products. This creates a secure, guaranteed market for manufacturers, lowering the risk of scaling up.
The State-Level Complication
However, manufacturers face a fragmented landscape at the state level.
5.4.4 Trends in Adoption and Consumer Preferences for PHA in USA
In the U.S., adoption is driven by corporate sustainability targets and a specific consumer preference for home composting.
The Price Reality
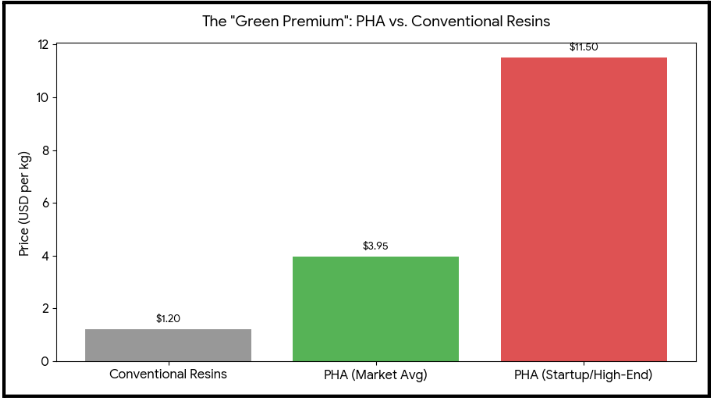
We must be transparent about the cost barrier. PHAs in the U.S. are currently 5 to 10 times more expensive than petroleum-based plastics.
While consumers say they want sustainable options, the “green premium” they are willing to pay has a limit. Acceptance drops drastically when the cost increase exceeds 20%.
The Home Composting Shift
Interestingly, there is a growing preference for PHA over other bioplastics like PLA (Polylactic Acid) because many PHAs are home-compostable. This is a crucial distinction in the U.S., where access to industrial composting facilities is limited.
5.4.5 Unique Trends, Real-World Examples, and Challenges for PHA in USA
The U.S. market is characterized by high-tech innovation to solve biological problems.
Technological Innovation
Key Industry Players
Real-World Applications
We are seeing PHA appear in everyday items, though often in niche markets:
Structural Challenges
Despite the innovation, there are significant hurdles:
5.5 Canada
Canada is one of the world’s leading producers of bioplastics, and Polyhydroxyalkanoates (PHAs) form an important part of its transition toward a circular, bio-based economy.
The Canadian approach stands out in two ways.
First, many companies focus on using waste materials such as food waste or gases as feedstock.
Second, Canada has developed specialised forms of PHA, particularly medium-chain-length PHA (mcl-PHA), which are softer and more elastic than the more rigid versions of the polymer.
This combination of feedstock innovation and material specialisation gives Canada a distinct position within the global PHA landscape.
Canada – PHA Market at a Glance
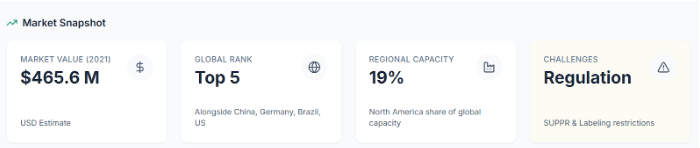
| Metric | Status |
|---|---|
| Bioplastics market value | US$465.6 million (2021) |
| Global production rank | Top five globally |
| North America share | ~19% of global capacity |
| Unique PHA specialization | mcl-PHA (PolyFerm Canada) |
| Key feedstocks | Food waste, wood cellulose, C1 gases |
| Organics access | 71% curbside access |
| Compost acceptance | Limited; most facilities reject compostable plastics |
| Main challenges | High cost, brittleness, strict labeling, composting gaps |
5.5.1 Current PHA Market Size and Global Share For Canada
Canada is consistently ranked among the top five global producers of bioplastics, alongside China, the United States, Germany, and Brazil.
In 2021, Canada’s bioplastics market was valued at approximately US$465.6 million.
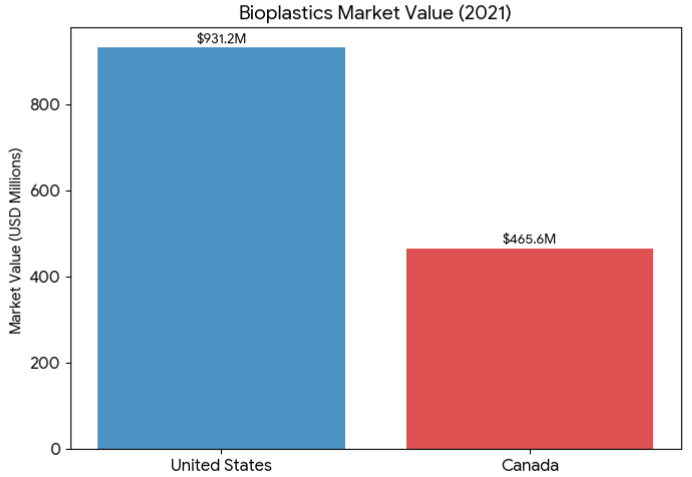
This places the Canadian market at roughly half the size of the US bioplastics market.
North America accounts for about 19% of global bioplastics production capacity, although Canada’s precise share of PHA alone is not publicly reported.
One of Canada’s structural advantages lies in its forestry sector. The country has access to large volumes of sustainably managed wood, which can be converted into cellulose-based feedstocks. This reduces reliance on food crops and lowers pressure on agricultural land.
While Canada is not the largest PHA producer globally, it plays a disproportionate role in technical innovation.
5.5.2 Growth Rate and Market Trajectory for PHA in Canada
Canada’s PHA sector is supported by federal policy and a national focus on reducing plastic waste.
The federal Zero Plastic Waste Agenda has created a policy environment that encourages alternatives to conventional plastics. At the same time, the country’s advanced research ecosystem supports pilot and demonstration projects.
Several companies illustrate this trajectory:
Genecis Bioindustries converts organic food waste into PHA. Its demonstration plant is designed to process approximately three tonnes of waste per week. The resulting material is used in products such as coffee pods and 3D printing filaments.
PolyFerm Canada is currently the only known company commercialising medium-chain-length PHA (mcl-PHA) at scale. Under the brand VersaMer™, it produces softer, more elastic polymers suitable for applications that require flexibility.
TerraVerdae Bioworks is working on producing PHA from C1 feedstocks, such as methane and carbon dioxide, expanding the possible raw material base beyond conventional biomass.
5.5.3 Market and Policy Evolution for PHA in Canada
Canada combines strong environmental policy with strict standards for labeling and compostability.
Federal Regulations
The Single-use Plastics Prohibition Regulations (SUPPR), enacted under the Canadian Environmental Protection Act (CEPA), ban several common plastic items such as checkout bags and cutlery.
However, the regulatory framework does not automatically exempt bio-based or biodegradable plastics. PHA products must meet durability and composting standards before they are permitted.
Labeling Controls
The federal government is moving toward banning misleading environmental claims. Products labeled as “biodegradable” or “compostable” will require third-party certification against recognised standards such as ASTM or ISO.
Provincial agencies, including the Bureau de Normalisation du Québec (BNQ), provide certification for industrial compostability based on international standards.
This strict approach reduces greenwashing but can slow commercial adoption.
Composting Infrastructure
Around 71% of Canadians have access to curbside organics collection, but most composting facilities do not accept compostable plastics.
There are two main reasons:
In Ontario, for example, compost applied to land can contain no more than 0.5% foreign matter by dry weight, including plastic fragments. This makes acceptance of compostable packaging more difficult.
As a result, many compostable plastics still end up in landfill.
5.5.4 Trends in Adoption and Consumer Preferences for PHA in Canada
PHAs are currently being used in:
Canada’s distinctive contribution is its focus on non-traditional feedstocks.
On the demand side, there is a divergence in perception.
Many composting facilities see compostable plastics as a contamination risk that adds no nutritional value to compost.
This gap between consumer expectation and infrastructure reality is a defining feature of the Canadian PHA market.
5.5.5 Unique Trends, Real-World Examples, and Challenges for PHA in Canada
Cost remains a major constraint for the adoption of PHA.
PHA production costs are estimated at 5 to 10 times higher than conventional petroleum-based plastics.
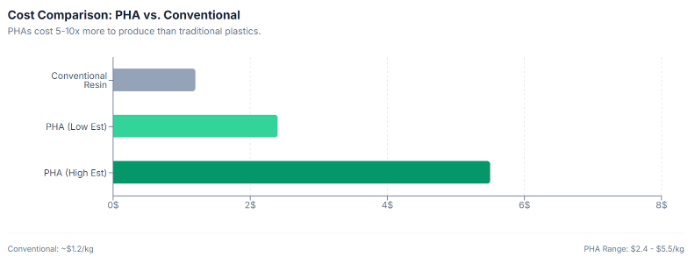
This cost difference limits adoption in mass-market applications. Most PHA products in Canada are positioned in higher-value or specialty segments rather than commodity packaging.
Overall, Canada’s experience shows that innovation alone is not sufficient. For PHAs to scale fully, material performance, pricing, labeling clarity, and waste infrastructure must evolve together.
5.6 Germany
Germany is the structural backbone of Europe’s bioplastics ecosystem, especially for Polyhydroxyalkanoates (PHA).
With a total plastics industry turnover exceeding EUR 100 billion in 2024, Germany operates at a scale where even small shifts toward bio-based materials translate into meaningful industrial impact.
Germany today accounts for 25.7% of the total European PHA market and contributes more than 40% of Europe’s bio-based plastics production. That dual strength — consumption plus production — is what defines Germany’s leadership.
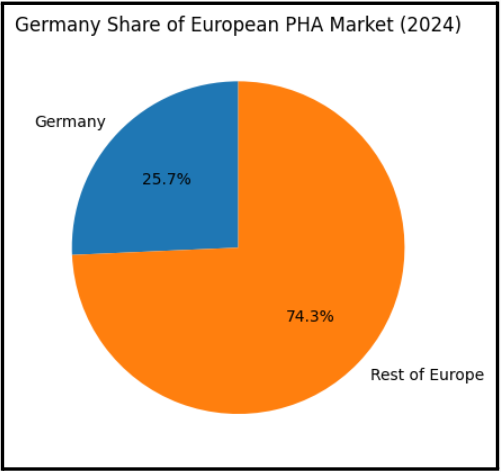
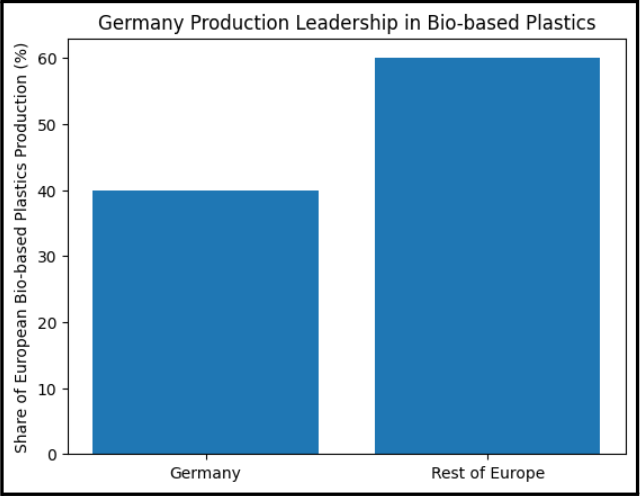
This position is supported by infrastructure few countries can match:
It is also the world’s second most attractive destination for foreign direct investment (FDI) in plastics.
That matters because capital-intensive fermentation technologies like PHA require precisely this kind of industrial maturity.
Germany – PHA Market at a Glance
| Metric | Status / Data Point |
|---|---|
| Share of European PHA market | 25.7% |
| Estimated German PHA market value | ~USD 5.59 million (2024) |
| Total European PHA market value | ~USD 21.76 million (2024) |
| Share of Europe’s bio-based plastics production | >40% |
| Share of biodegradable materials in German bioplastics capacity | ~51% |
| Total plastics industry turnover | >EUR 100 billion (2024) |
| European PHA market CAGR (to 2033) | ~11.46% |
| Key application sectors | Packaging, medical, automotive, agriculture |
| Core policy drivers | EU Green Deal; Single-Use Plastics Directive; German Packaging Act (EPR) |
| Main challenges | Higher production cost; composting gaps; consumer confusion; scale-up complexity |
5.6.1 Current PHA Market Size and Global Share For Germany
The total European PHA market was valued at USD 21.76 million in 2024. With Germany holding 25.7% share, its domestic PHA market is estimated at approximately USD 5.59 million.
In absolute terms, this may appear small. But two realities must be understood:
Germany is also one of the five largest bioplastics producers globally, alongside China, the United States, Brazil, and Canada. # That ranking is not just about PHA volume. It also reflects broader competence in bio-based polymer production.
A particularly important structural detail is that 51% of Germany’s bioplastics production capacity is biodegradable materials (such as PHA and PLA).
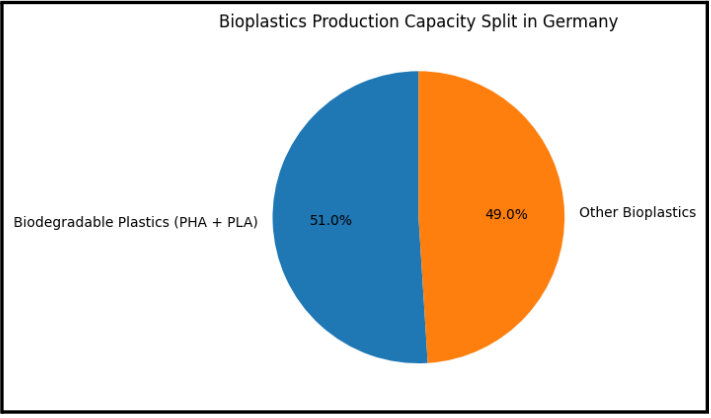
5.6.2 Growth Rate and Market Trajectory for PHA in Germany
The European PHA market is projected to reach USD 57.77 million by 2033, growing at a CAGR of 11.46%.
Germany is positioned to capture a significant portion of this growth.
The acceleration is being driven by:
In Germany, PHA is no longer viewed solely as a compostable packaging polymer. It is increasingly moving into:
Germany’s automotive production (4.1 million vehicles in 2024) makes lightweighting and sustainable materials strategically important.
The country’s commitment to hosting the 4th PHA World Congress (Düsseldorf, September 2025) further reinforces its position as a global convener of expertise.
5.6.3 Market and Policy Evolution for PHA in Germany
Germany’s PHA evolution is anchored in structured regulatory frameworks.
PHAs are classified as second-generation bioplastics, which means they are produced via true biotechnological processes rather than chemical modification of natural polymers.
Policy drivers include:
Germany also actively supports cluster development through programs such as:
The policy environment reduces investment risk. That is critical for PHA, where production remains cost-intensive.
Adoption Patterns: Premium and Performance-Driven
Germany’s adoption pattern is different from purely price-sensitive markets. It is technical and performance-oriented.
Packaging
Packaging represents roughly 35–48% of total plastics use. PHA is increasingly used for:
The emphasis is on certified compostability and compliance with circular economy targets.
Medical Technology
Germany is Europe’s largest medical device market. PHA’s biocompatibility gives it strong positioning for:
Automotive
Vehicle manufacturers are exploring PHA blends for:
Agriculture
PHA mulch films and nets solve a major problem — residual plastic accumulation in soil.
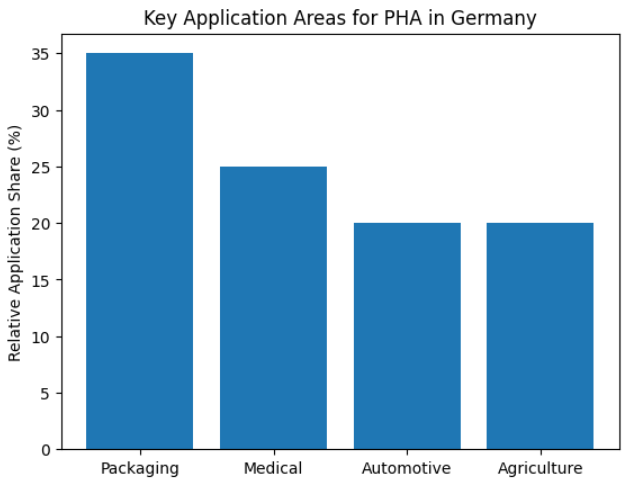
5.6.4 Trends in Adoption and Consumer Preferences for PHA in Germany
Consumer support for PHA is strong. 85% of Europeans support plastic waste reduction initiatives.
This creates a brand pull, because of which cosmetics and food service companies increasingly demand compostable packaging.
However, economics remains decisive.
PHA production in Germany can be up to 30% more expensive than petroleum plastics due to:
Historically, PHA competitiveness improves when crude oil prices rise. Oil-linked volatility remains a structural factor.
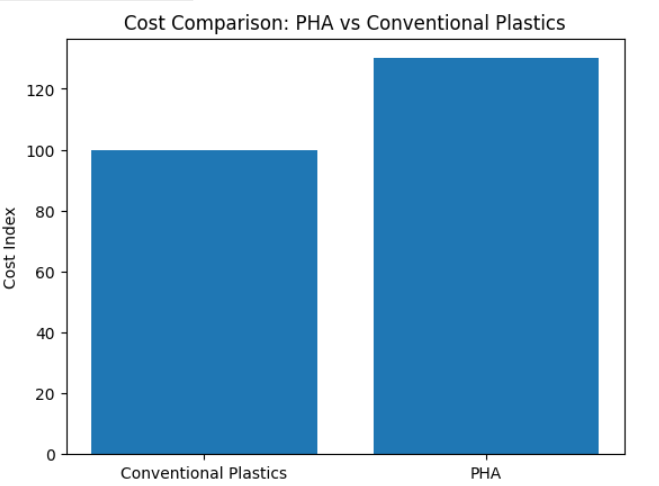
Unique Technological Directions
Germany differentiates itself through advanced feedstock innovation.
CO₂-to-PHA
A German biotech firm has patented a fermentation process converting industrial CO₂ emissions into PHA.
This approach:
Alternative Carbon Sources
Institutions such as Fraunhofer IGB are researching methane from biogas, forestry residues, and glycerol (biodiesel by-product).
Custom Formulations
Companies like Corvay Specialty Chemicals are tailoring PHA grades for injection moulding, 3D printing, coatings, and technical parts. This moves PHA beyond commodity positioning.
5.6.5 Unique Trends, Real-World Examples, and Challenges for PHA in Germany
Three major challenges persist:
1. Disposal
2. Consumer Confusion
3. Scale Gap
Germany is clearly ahead of many other European nations, in terms of its PHA market.
The next phase will determine whether PHA becomes a structural pillar of European plastics or remains a high-value niche material within an otherwise fossil-dominated industry.
5.7 United Kingdom
For the UK, PHA is not just another material innovation. It is viewed as a strategic lever within the country’s transition toward a circular bioeconomy.
The commercial momentum reflects this shift. The total UK bioplastics sector is projected to reach approximately £500 million by 2025. While continental Europe currently dominates PHA production, the UK has established itself as a fast-moving growth centre for next-generation biomaterials.
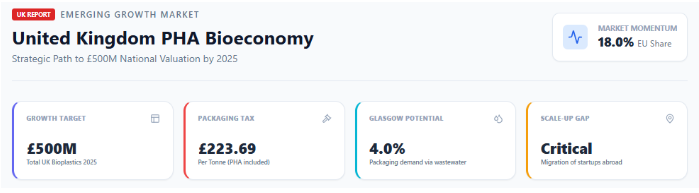
United Kingdom – PHA Market at a Glance
| Metric | Status / Data Point |
|---|---|
| Share of European PHA market | ~18% |
| Total European PHA market value | ~USD 21.76 million (2024) |
| UK bioplastics sector value | ~£500 million projected by 2025 |
| Global PHA growth outlook | ~29.40% CAGR (2026–2034, global) |
| European PHA CAGR | ~11.46% (2025–2033) |
| Key policy frameworks | Plastic Packaging Tax; SUP bans; 25-Year Environment Plan |
| Plastic Packaging Tax threshold | <30% recycled content taxed |
| Typical PHA price range | €1.18 – €6.12/kg |
| Key innovation areas | Wastewater-based PHA; lignin conversion; chemical recycling (hydrolysis) |
| Core challenges | Composting infrastructure gaps; regulatory definitions; scale-up capacity |
5.7.1 Current PHA Market Size and Global Share For United Kingdom
Europe holds approximately 47% of the global PHA market share as of 2025. Within this European ecosystem (valued at USD 21.76 million in 2024) the United Kingdom accounts for roughly 18% of total market share.
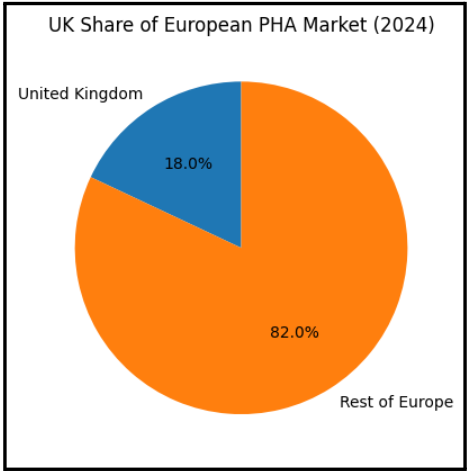
This positioning places the UK firmly within the core European adoption cluster.
Two structural observations matter:
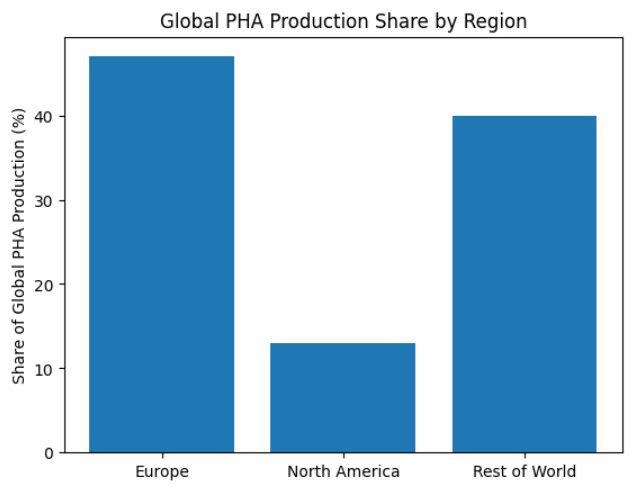
This growth is primarily demand-led rather than supply-led. Domestic production capacity remains limited, but market appetite is accelerating.
5.7.2 Growth Rate and Market Trajectory for PHA in United Kingdom
Globally, the PHA market is forecast to grow at a CAGR of 29.40% between 2026 and 2034.
The wider European market is projected to grow at 11.46% CAGR from 2025 to 2033.
To participate meaningfully, the UK bioplastics sector is positioned to invest approximately £500 million in the short term.
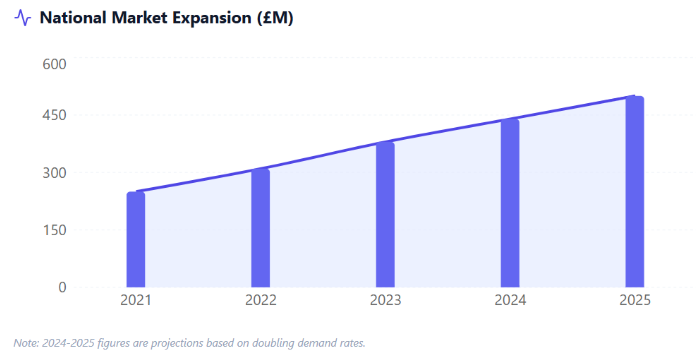
Three structural drivers define the UK trajectory; they are:
1. Regulatory Pressure
2. Corporate Sustainability Commitments
3. Engineering Biology Strength
5.7.3 Market and Policy Evolution for PHA in United Kingdom
The UK’s long-term environmental ambitions are clear.
Key national commitments include:
These frameworks signal strong high-level support for bio-based materials.
Yet implementation presents complexity.
Plastic Packaging Tax (PPT)
Introduced in April 2022, the Plastic Packaging Tax penalizes packaging with less than 30% recycled content.
Under current legal definitions:
As a result, PHA packaging is currently liable for the tax.
Single-Use Plastics (SUP) Bans
Across England, Scotland, and Wales, bans on items such as plastic cutlery have been enacted.
The legal definition of “plastic” includes bio-based and biodegradable polymers. This means many compostable PHA products are inadvertently restricted alongside fossil plastics.
This contradiction creates market uncertainty. The UK’s strategic intent supports bioplastics, but certain regulatory definitions slow adoption.
5.7.4 Trends in Adoption and Consumer Preferences for PHA in United Kingdom
Despite policy friction, market adoption is accelerating.
Consumer Sentiment
The public conversation around ocean plastic pollution has directly influenced purchasing behaviour.
Retail Adoption
Major UK retailers (including COOP, Aldi, Waitrose, and Lidl) have adopted compostable carriers and produce bags.
Global consumer brands operating in the UK, such as Unilever, Mars Wrigley, and Nestlé, are integrating compostable plastics into selected packaging formats.
Sector-Specific Adoption
PHA is gaining traction in:
Pricing Constraint
However, pricing remains a central constraint.
PHA production can be up to 30% more expensive than petroleum-based plastics. Current price ranges for PHA are between €1.18 and €6.12 per kilogram, compared to traditional polymers often priced below €1/kg.
Feedstock Innovation and Circular Approaches
The UK distinguishes itself through innovation in both feedstock sourcing and end-of-life solutions.
Wastewater-Based PHA (Glasgow Case)
Research in Glasgow suggests that extracting PHA from primary sewage sludge could be economically viable.
If implemented nationally across Scottish wastewater plants, this approach could replace up to 4% of Scotland’s annual plastic packaging demand.
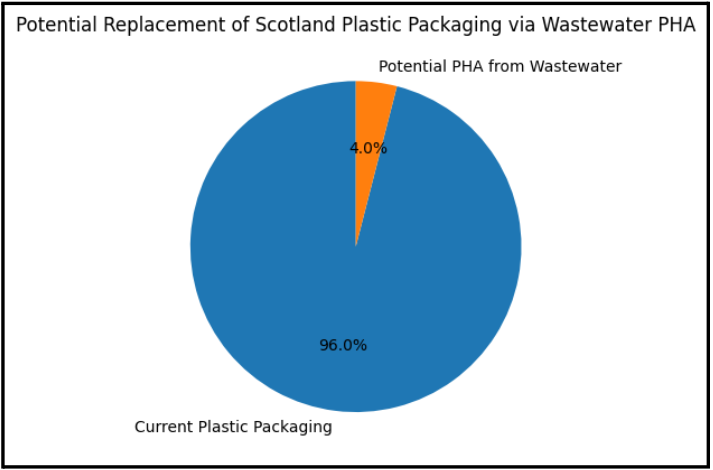
Lignin-Based Bioplastics (Warwick)
At the University of Warwick, researchers are working to convert lignin, a by-product of paper manufacturing, into high-quality bioplastics.
Recycling Beyond Composting: RePHASe
The RePHASe project at the University of Birmingham focuses on hydrolysis, which is a process that breaks PHA back into its original building blocks (monomers).
This approach:
It represents a shift from “biodegrade and discard” toward “recover and re-manufacture.”
5.7.5 Unique Trends, Real-World Examples, and Challenges for PHA in United Kingdom
Several UK-based applications demonstrate practical deployment:
These examples show diversification beyond simple carrier bags.
Structural Challenges
Two infrastructure constraints remain significant.
1. Industrial Composting Gap
2. Scale-Up Gap
The UK has clear intellectual leadership in advanced biopolymer development. The decisive factor will be whether regulatory frameworks and industrial infrastructure evolve fast enough to convert that leadership into sustained domestic production scale.
The direction is set. Execution remains the critical variable.
5.8 Italy
Italy is one of the most developed bioplastics markets in Europe.
Italy combines three advantages:
Polyhydroxyalkanoates (PHAs) are part of this wider ecosystem of bioplastics in the country.
Italy – PHA Market at a Glance
| Metric | Status / Data Point |
|---|---|
| Total fossil plastic consumption | ~5.9 million tons (2020) |
| Bioplastics share of plastics market | ~1.5%–2% (double global average) |
| Biodegradable/compostable polymer production | ~111,000 tons (2020) |
| Sector turnover | ~€815 million |
| Number of companies in value chain | ~280 |
| Early PHA plant capacity (Bio-on) | ~1,000 tons/year |
| Long-term decarbonisation scenario | Bio-based plastics up to 30% by 2050 |
| Economic policy tools | EU Plastic Tax (€0.8/kg); proposed Italian Plastic Tax (€0.45/kg) |
| Key application sectors | Cosmetics, medical, agriculture, electronics |
| Core challenges | High cost; brittleness (PHBV); composting/sorting gaps |
5.8.1 Current PHA Market Size and Global Share For Italy
Italy is the second largest plastics consumer in Europe, using 5.9 million tons of fossil-based polymers in 2020. Within this large market, bioplastics represent approximately 1.5% to 2% of total plastics placed on the market.
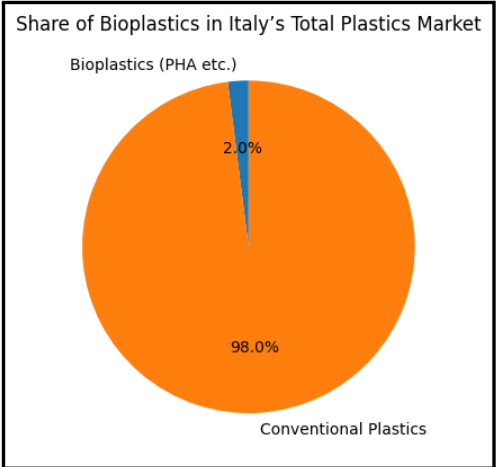
This may seem small, but it is roughly double the global average, where bioplastics account for about 1% of total plastics.
The broader Italian biodegradable and compostable polymer sector produced 111,000 tons in 2020, involving 280 companies and generating a turnover of €815 million.
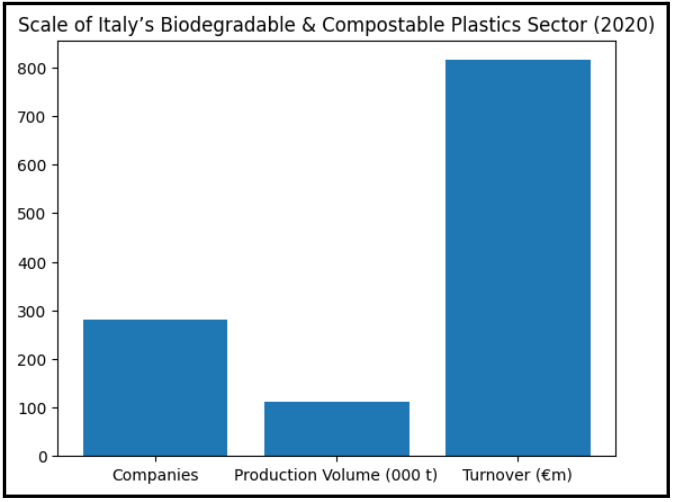
This indicates that Italy has:
- A structured supply chain
- Established converters
- Commercial-scale operations
Bio-on’s initial PHA plant had a capacity of 1,000 tons per year, with plans for expansion. Unlike many countries that depend entirely on imports, Italy has domestic production capability, which reduces supply-chain risk.
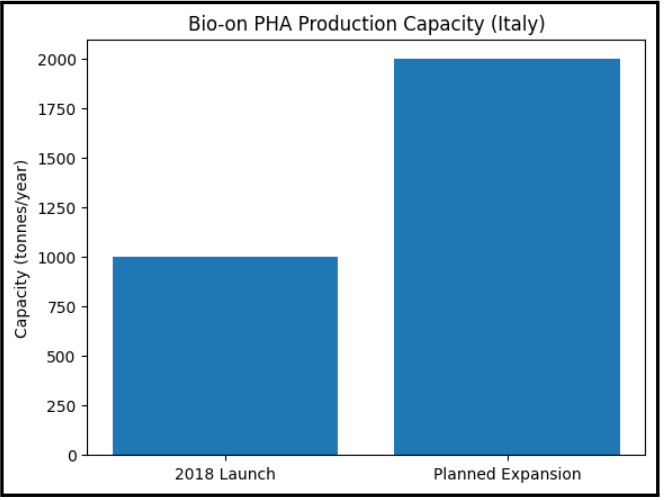
5.8.2 Growth Rate and Market Trajectory for PHA in Italy
Italy’s bioplastics sector has grown steadily over the past decade.
Between 2013 and 2016, production increased by 59%.
Between 2016 and 2020, turnover in the plastics recovery and recycling phase grew by 40%.
Looking ahead, long-term decarbonisation scenarios suggest that bio-based plastics could account for up to 30% of Italian plastic consumption by 2050, if fossil-based plastics are progressively replaced.
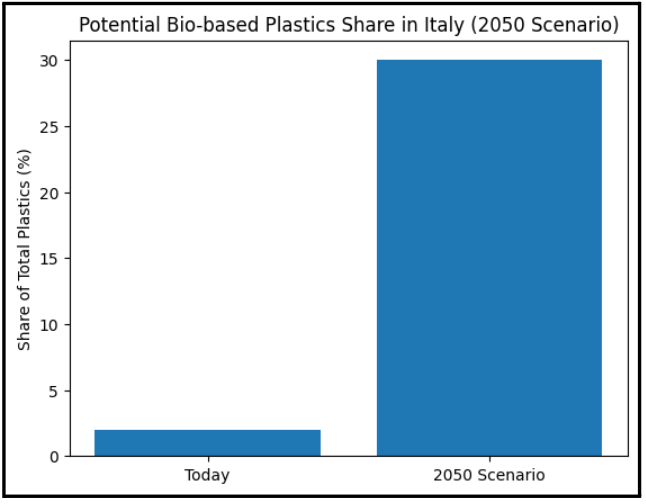
Future growth depends heavily on cost reduction.
POLìPO’s alternative chemical production route aims to:
- Reduce operating costs by 35%
- Reduce plant investment costs by 70–80%
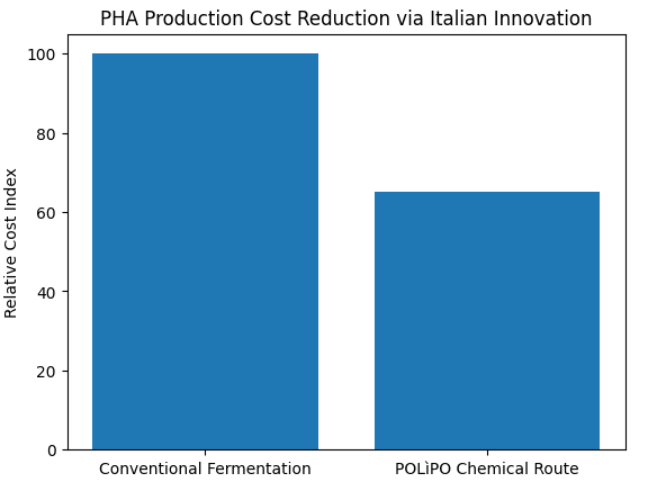
If successful at scale, such process innovation could make PHA more competitive beyond niche applications.
Italy’s trajectory therefore depends on two parallel forces:
5.8.3 Market and Policy Evolution for PHA in Italy
Italy’s leadership in bioplastics is closely linked to both scientific tradition and strong legislation.
Italy has a long polymer science history. In 1963, Giulio Natta received the Nobel Prize for work in polymer chemistry. This legacy laid the foundation for later developments in bio-based materials.
In 2011, Italy banned conventional plastic shopping bags. Only biodegradable and compostable alternatives were allowed. Over ten years, this led to a 60% reduction in shopping bag consumption.
In 2018, new rules required ultralight fruit and vegetable bags to be compostable and contain renewable content. This renewable content requirement increased to 60% by 2021.
In 2021, Italy implemented the EU Single-Use Plastics Directive, encouraging the replacement of fossil-based disposable items with compostable alternatives.
Economic tools further support this shift:
These measures increase the cost of virgin fossil plastics, improving the relative position of bio-based alternatives like PHA.
In Italy, legislation does not just encourage change. It forces market adaptation.
5.8.4 Trends in Adoption and Consumer Preferences for PHA in Italy
Italian consumers and industries prefer materials that:
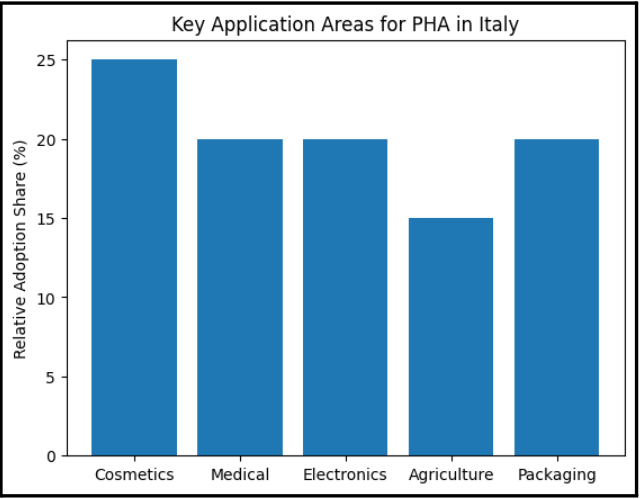
5.8.5 Unique Trends, Real-World Examples, and Challenges for PHA in Italy
Italy stands out for its focus on waste-based feedstocks.
B-Plas works on converting wastewater and industrial sludge into PHA. Bio-on uses agricultural by-products such as sugar beet waste. This reduces competition with food crops and supports circular economy principles.
There are also unusual industrial experiments.
The Advanced Materials Tobacco Labs (AMT) in Bologna is researching PHA for cigarette filters. The goal is to reduce toxic release and ensure filters degrade if discarded.
PHA micro-powders are being tested for marine oil spill treatment. These powders stimulate oil-degrading bacteria, potentially cleaning seawater in about 20 days.
Despite its strengths, Italy faces clear challenges.
Italy’s PHA market is advanced compared to many countries, but it is still developing. The foundation is strong: scientific capability, industrial infrastructure, and supportive legislation.
However, cost competitiveness and end-of-life infrastructure will determine whether PHA moves from specialised applications to wider mainstream adoption.
5.8 Australia
Australia’s PHA story is shaped by geography.
As a large island continent with long coastlines and fragile marine ecosystems, Australia views Polyhydroxyalkanoates (PHA) as a material with specific environmental relevance.
In Australia, marine and soil biodegradability is central to use of bioplastics. Unlike some bioplastics that require industrial composting conditions, PHA can degrade under ambient conditions.
That makes it attractive in a country where plastic leakage into oceans is a visible and public concern.
The current market is still small, and PLA (polylactic acid) dominates the bioplastics space.
However, local innovators are building a distinct Australian pathway:
Despite these developments, Australia still imports most of its bioplastics from Thailand and Brazil.
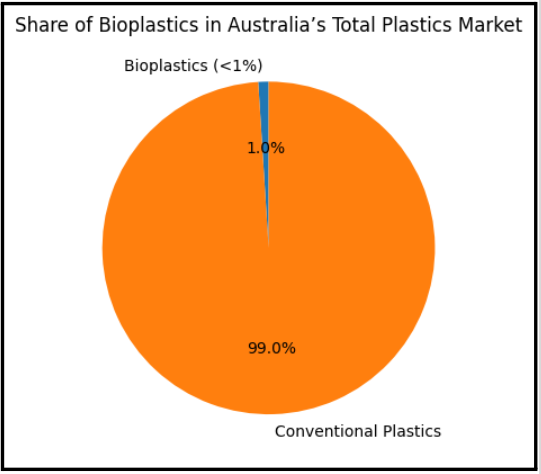
Within the global context, the Australia/Oceania region accounts for only 0.5% of global bioplastics production capacity. By comparison:
- Asia holds 41.4%
- Europe holds 26.5%
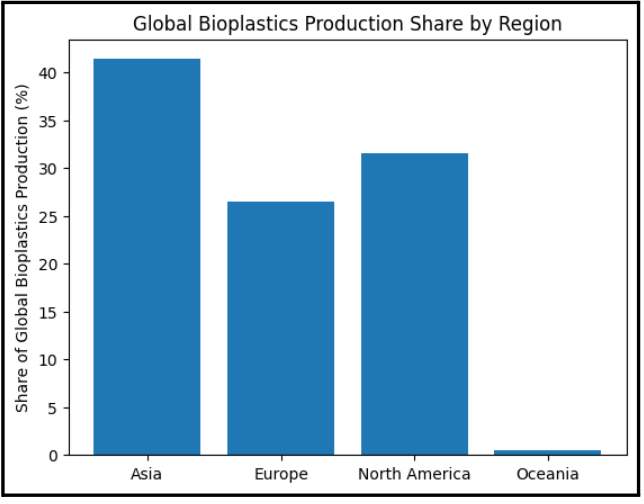
Australia – PHA Market at a Glance
| Metric | Status / Data Point |
|---|---|
| Share of global bioplastics capacity (Oceania) | ~0.5% |
| Bioplastics share of national plastic consumption | <1% |
| PLA imports | ~10,000 tonnes annually |
| Global PHA share (reference) | ~3.9% of total bioplastics capacity |
| Broader bioplastics CAGR | ~7.6% (2025–2031) |
| Flexible packaging market size | ~USD 1.68 billion by 2030 |
| Certification standards | AS 4736 (industrial); AS 5810 (home compostable) |
| Key innovators | Uluu (seaweed-based PHA); EcoPHA (pongamia oil route) |
| Main feedstocks under development | Seaweed, pongamia oil, sugarcane bagasse, organic waste |
| Core challenges | Limited composting infrastructure; import dependence; scale-up costs |
5.8.1 Current PHA Market Size and Global Share For Australia
Australia’s bioplastics market remains modest.
Bioplastics represent less than 1% of total plastic consumption in the country.
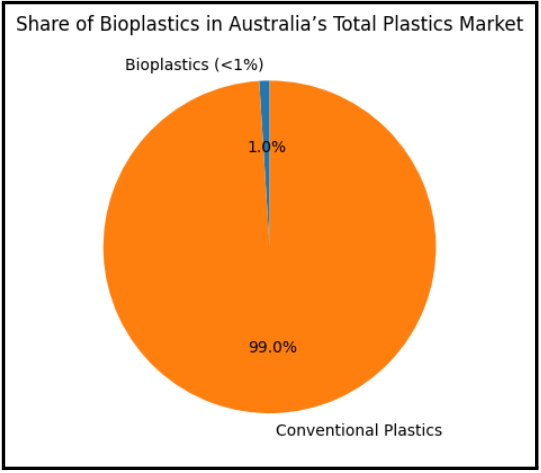
Within the global context, the Australia/Oceania region accounts for only 0.5% of global bioplastics production capacity. By comparison:
- Asia holds 41.4%
- Europe holds 26.5%
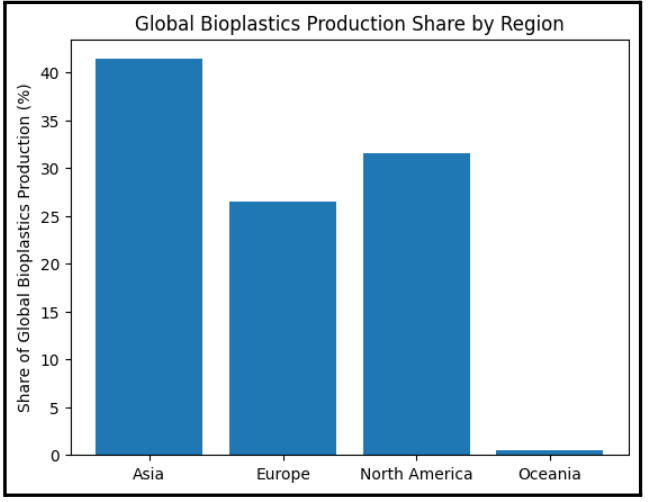
PHA-specific consumption data in Australia is limited. The industry has not yet reached large-scale deployment, so reliable national consumption figures are not available.
In contrast, Australia imports an estimated 10,000 tonnes of PLA annually, which shows how early the PHA segment remains.
Globally, PHA accounts for about 3.9% of total bioplastics production capacity, compared to PLA at 20.7%.
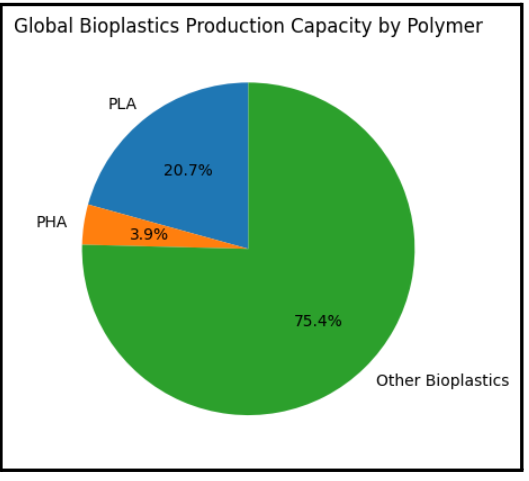
Australia’s PHA footprint therefore mirrors global reality: promising, but still emerging.
The small base, however, also means growth potential is high.
5.8.2 Growth Rate and Market Trajectory for PHA in Australia
The broader Australian bioplastics market is projected to grow at a CAGR of 7.6% between 2025 and 2031.
A key driver is flexible packaging. The Australian flexible packaging market is expected to reach USD 1.68 billion by 2030, and bioplastics are gradually gaining space within this segment.
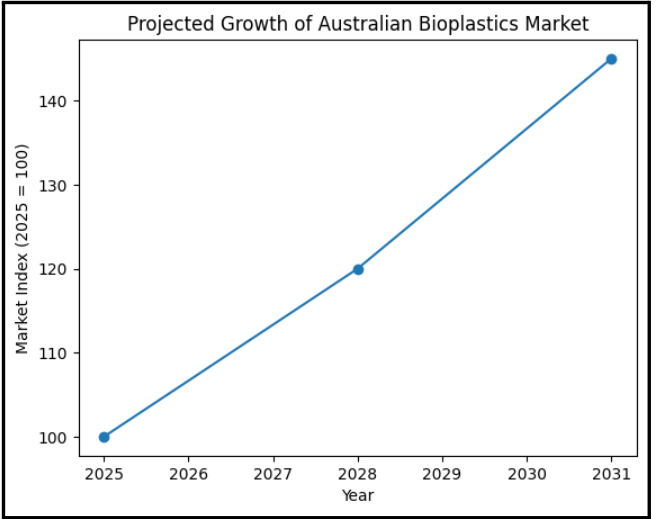
PHA’s long-term trajectory is tied to three structural shifts:
5.8.3 Market and Policy Evolution for PHA in Australia
Australia’s bioplastics ecosystem has evolved into a more formal circular economy framework.
Since 2006, the Australasian Bioplastics Association (ABA) has administered certification schemes aligned with:
These standards are critical. In a market where green claims are common, certification defines credibility.
Policy milestones include:
However, regulatory fragmentation continue to be a challenge.
Different states have implemented single-use plastic bans, but definitions vary:
At the same time, the Australian Competition and Consumer Commission (ACCC) has tightened oversight on environmental marketing claims.
5.8.4 Trends in Adoption and Consumer Preferences for PHA in Australia
Consumer preference in Australia is clearly shifting toward home compostable solutions.
Industrial composting infrastructure is unevenly distributed. Therefore, materials that can degrade in backyard compost systems are preferred.
PHA fits this expectation.
Key adoption areas include:
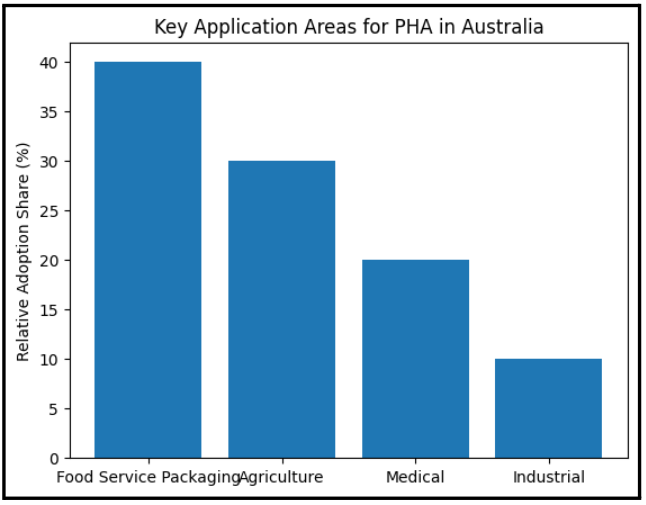
Note: PHA commands a premium due to smaller production scale and fermentation complexity. However, when lifecycle costs are calculated its value proposition becomes stronger in specific sectors.
5.8.5 Unique Trends, Real-World Examples, and Challenges for PHA in Australia
Australia’s distinct contribution lies in marine biodegradability and feedstock innovation.
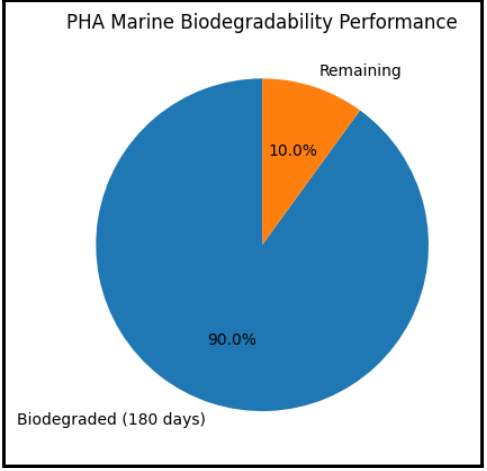
However, structural barriers remain.
So, overall Australia’s PHA market is small but strategically positioned.
The country’s long coastline, marine sensitivity, and agricultural base create strong alignment with PHA’s properties. The innovation ecosystem is active. Policy direction supports circularity.
The key question is scale.
If domestic production, infrastructure alignment, and regulatory clarity progress together, Australia could shift from niche importer to regionally relevant producer. If not, PHA will remain promising—but peripheral—in the national plastics landscape.
5.9 Brazil
Brazil’s position in the PHA landscape is defined by one structural strength: feedstock.
Unlike many countries that must import sugars or rely on food crops with higher costs, Brazil is the world’s largest producer of sugarcane.
That single fact shapes its bioplastics trajectory.
Polyhydroxyalkanoates (PHA) in Brazil are closely tied to the sugar and ethanol economy.
The country’s narrative is therefore agricultural and industrial at the same time.
A major milestone was the EUR 80 million agreement between Moore Capital and Bio-on to establish Brazil’s first dedicated PHA production facility.
The planned plant was designed to use sugarcane co-products (waste streams from sugar processing) and target 10,000 tons per year capacity.
Alongside this industrial ambition, local manufacturers such as PHB Industrial S.A. produce P(3HB) (a type of PHA) under the “BIOCYCLE” trademark using hydrolyzed sucrose.
Brazil’s advantage is clear:
The question is not whether the feedstock exists. It does. The question is whether production, infrastructure, and market economics can align at scale.
Brazil – PHA Market at a Glance
| Metric | Status / Data Point |
|---|---|
| Share of global bioplastics capacity | ~9.5% |
| Key structural advantage | World’s largest sugarcane producer |
| Planned industrial PHA capacity | 10,000 tons/year (proposed plant) |
| Current PHB production | ~50–100 tons/year (PHB Industrial S.A.) |
| Additional PHA production | ~100 tons/year (Biocycles) |
| Feedstock cost (molasses) | ~USD 0.11/kg |
| Major policy drivers | National Policy on Solid Waste; RenovaBio; state-level SUP bans |
| Main feedstocks | Sugarcane molasses, ethanol co-products, wastewater sludge |
| Cost differential vs PE | 5–10× higher |
| Core challenges | Waste infrastructure gaps; tax complexity; scale-up stability |
5.9.1 Current PHA Market Size and Global Share For Brazil
Brazil accounts for 9.5% of global bioplastics production capacity.
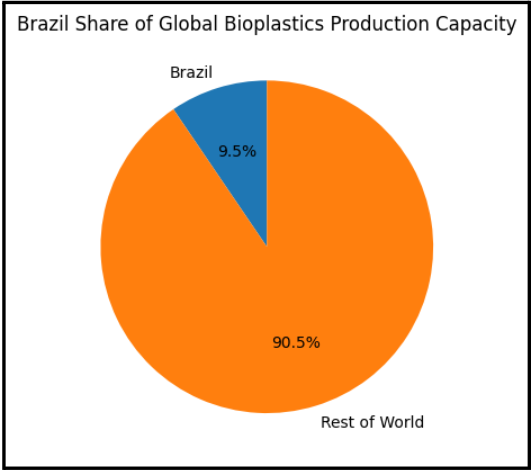
However, this figure includes starch-based plastics and PLA. PHA remains a smaller segment within this total.
Current PHA production volumes reflect this early stage:
Historically, PHB/PHA accounted for about 8.7% of Brazil’s total bioplastics volume around 2009. This shows that the country has long-standing familiarity with the polymer, even if scaling has been gradual.
Compared to Brazil’s massive petrochemical output, these figures are modest. But they represent a base that can grow rapidly if industrial-scale plants operate as planned.
Brazil is therefore not yet a dominant PHA producer, but it is structurally positioned to become one.
5.9.2 Growth Rate and Market Trajectory for PHA in Brazil
Brazil’s growth story is feedstock-driven.
In PHA manufacturing, raw material costs are decisive. In Brazil, sugarcane molasses is priced at approximately USD 0.11 per kilogram, significantly cheaper than refined glucose or sucrose used in other countries.
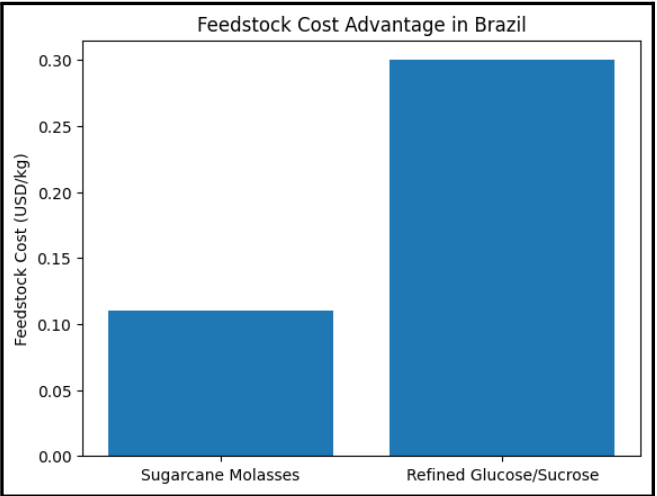
This gives Brazil a built-in cost advantage.
The trajectory is shaped by three parallel forces:
1. Industrial Scaling Ambition: The Moore Capital–Bio-on project aimed to establish a 10,000-ton-per-year facility. This signals a move from pilot production toward industrial scale
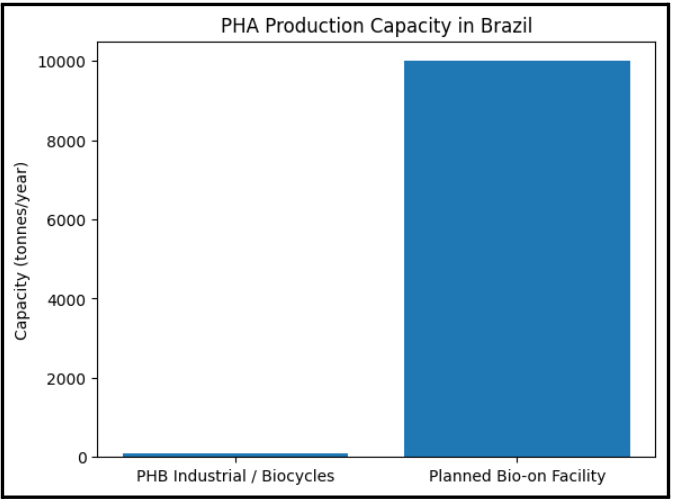
Through initiatives such as the WOW! project, researchers are exploring PHA production from secondary sludge. Bacteria convert volatile fatty acids in wastewater into bioplastic. This could lower feedstock costs and improve environmental performance.
The long-term trajectory is clear:
Brazil aims to leverage low-cost agricultural residues to compete internationally.
5.9.3 Market and Policy Evolution for PHA in Brazil
Brazil’s PHA evolution is rooted in its bioenergy history.
The Proalcool program (1975) was launched to replace gasoline with ethanol. This program created a nationwide network of sugarcane biorefineries. That infrastructure now forms the backbone of Brazil’s potential PHA ecosystem.
The shift from fuel to materials is therefore an extension of an existing model.
Key policy milestones include:
Brazil’s regulatory approach is less centralized than the European Union’s, but localized bans have created targeted demand for biodegradable materials.
The country’s strength lies in its integrated sugar-ethanol system. Its weakness lies in waste infrastructure.
5.9.4 Trends in Adoption and Consumer Preferences for PHA in Brazil
Adoption in Brazil is largely “top-down.”
Large retailers and multinational brands influence demand more strongly than consumer activism alone.
Key patterns include:
However, cost remains decisive. PHA in Brazil can be 5 to 10 times more expensive than polyethylene. Although technology improvements and oil price volatility narrow the gap, the premium is substantial.
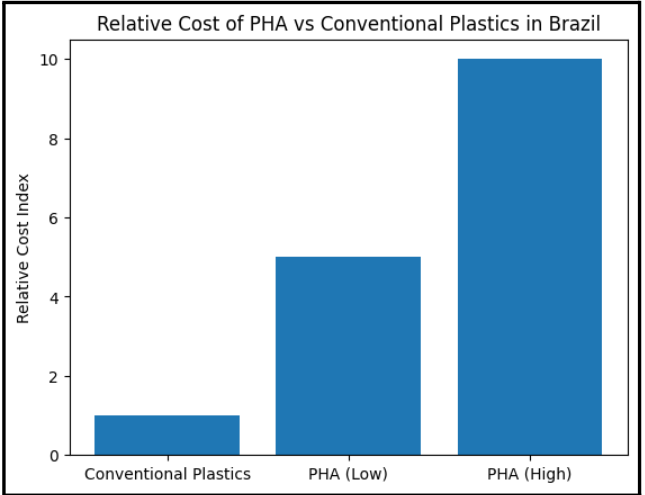
There is growing interest in cashback-style return systems, but these remain limited in implementation.
5.9.5 Unique Trends, Real-World Examples, and Challenges for PHA in Brazil
Brazil’s uniqueness lies in its integrated biorefinery model.
Integrated Biorefineries
In Brazil’s sugar industry:
These by-products can serve as feedstock for PHA fermentation.
Fuel alcohols produced during fermentation can also be reused within the extraction process. This increases energy efficiency compared to standalone plastic production facilities.
Academic Innovation
At the Universidade Federal de Viçosa, researchers are studying PHA extraction from industrial effluents. By using bacteria to process wastewater, they convert a disposal challenge into a value-added material.
Core Challenges
Brazil’s constraints are structural.
Brazil demonstrates that feedstock abundance is only the first step.
The country has:
What remains to be solved is:
If those elements converge, Brazil could shift from being a “sleeping giant” to a global PHA export platform.
If not, PHA will remain a technically promising but economically niche segment within its vast agricultural economy.
6. Global Leaders In PHA Production
Here are the leadership profiles for the key global players in the Polyhydroxyalkanoates (PHA) industry.
6.1 Tianan Biologic Material Co., Ltd.

Tianan Biologic is the “Elder Statesman” of the PHA world. They are the globally recognized leader and the largest producer of PHBV (a specific, flexible type of PHA).
•While many companies are just now building their first pilot plants
◦Tianan has been operating at an industrial scale for over two decades
•Their leadership is defined by multiple “world-firsts”
◦First kilotonne-scale production plant
◦Mastery of water-based extraction (eliminates harsh chemical solvents)
Company Overview
•Headquartered in: Ningbo, Zhejiang province, People’s Republic of China.
•Year Founded: 2000.
•Major Markets Served: Global markets for consumer packaging (bags, cutlery), textiles, automotive parts, agriculture (mulch films), and pharmaceuticals.
•Annual Bioplastics Production Capacity: Approximately 2,000 metric tons, with future expansion plans targeting 50,000 tons.
•Key PHA Based Product(s) and Competencies:
◦ENMAT™: Their flagship range of biopolymer resins.
◦PHBV (Y1000™): A flexible copolyester known for its balanced mechanical properties.
◦PHB (Y3000™): A high-performance homopolyester for rigid injection molding.
Major Highlights
•First in the world to achieve commercial production using a 100% water-based extraction process (2004).
•Their material is certified for 100% disintegration in seawater within 12 weeks.
•Holds EU Food Contact Approval (FCM No. 744), making it a safe, global standard for sustainable food packaging.
6.2 Kaneka Corporation

Kaneka is the pioneer of PHBH, a specialized PHA that bridges the gap between high-strength plastics and rapid biodegradability. Their leadership stems from a 30-year head start. They discovered their production microbe in the soil of their own manufacturing site in the early 90s. Today, Kaneka is the “Scale Leader,” and operates one of the largest dedicated PHA facilities in the world.
Major Highlights
6.3 RWDC Industries

RWDC is the “Circular Visionary” of the sector. Their leadership is built on a unique feedstock strategy: they produce high-quality PHA by upcycling used cooking oil. This dual-impact model has attracted massive global investment. They focus on “Biovanescence,” which means creating materials that vanish completely in nature without leaving microplastics.
Major Highlights
6.4 Bluepha

Bluepha represents the “Next Generation” of industrial biotechnology. Their leadership is defined by their NGIB (Next-Generation Industrial Biotechnology) approach. Unlike traditional producers who need sterile, high-cost environments, Bluepha uses extremophilic bacteria that thrive in high-salt environments. This allows them to use seawater instead of precious freshwater for fermentation.
Major Highlights
6.5 Biomer

Biomer is the “Scientific Anchor” of the European PHA industry. Founded by Dr. Urs Hänggi, the company maintains the intellectual legacy of early PHA research from the 1980s. Their leadership is characterized by their resilience and specialization in PHB homopolyesters. Biomer focuses on technical parts and high-crystallinity resins that offer superior gas barriers and solvent resistance.
Major Highlights
6.6 PHB Industrial (Biocycle®)

PHB Industrial is the “Sustainability Pioneer” of South America. Their leadership is defined by an unparalleled commitment to Energetic Autarky (the ability to run a chemical plant entirely on the waste from its own production cycle). By integrating their PHA plant directly into a sugarcane mill, they created a carbon-negative model that remains the gold standard for circular bioplastic manufacturing.
Major Highlights
6.7 Helian Polymers

Helian Polymers is the “Strategic Navigator” of the European bioplastic market. Unlike primary producers, Helian’s leadership lies in Application Engineering and Global Partnership Management. They act as the vital bridge between complex biopolymer chemistry and the real-world manufacturing floor. Their expertise in compounding (mixing polymers to achieve specific properties) and their strategic alliance with Bluepha make them a key gateway for Chinese PHA technology entering the Western market.
Major Highlights
6.8 UKHI India Private Limited

Ukhi is an IP-led material innovation leader that has redefined the bioplastics landscape in India. Ukhi has carved out a dominant position by utilizing 2nd-generation lignocellulosic waste (specifically hemp, flax, and rice husks). Our leadership is defined by a rural regeneration model: we empower farmers by converting low-value agricultural residue into high-performance, industrial-grade biopolymers. As of early 2026, Ukhi has successfully transitioned to a commercially scaling powerhouse.
Major Highlights
7. Opportunities, Risks & Strategic Outlook for PHA Bioplastics
Polyhydroxyalkanoates (PHAs) are described as “future-ready” bioplastics for one practical reason: they combine two properties in one material family.
This combination is still rare in the bioplastics world.
It is also why PHAs attract serious attention from regulators, brands, and material scientists, even though they are a small part of today’s market.
At the same time, PHAs are not yet a mass-market replacement for PE or PP. Their growth will depend on whether the industry can bring costs down, scale supply, and make end-of-life handling clear and credible.
7.1 Key Market Opportunities
1. Waste-to-wealth feedstocks can change the cost equation
PHA can be produced from “secondary” feedstocks (these are materials that are currently treated as waste or low-value by-products). Examples already being explored are:
This matters because raw materials can be about half of total PHA production cost.
So, if the feedstock shifts away from food-grade sugars and oils, the economics become more realistic.
2. Natural-environment biodegradability is a real differentiator
Many bioplastics need high-heat industrial composting conditions to break down properly.
PHAs stand out because they are positioned as the only commercial biopolymer family that is certified to biodegrade in saltwater, freshwater, and soil.
This opens up use-cases where “escape into the environment” is a real risk.
It also connects directly to public and regulatory concern about microplastics in oceans and waterways.
3. Strong fit for high-value niches where biodegradability is not optional
PHAs already have demand in areas where material performance and end-of-life safety matter more than lowest cost:
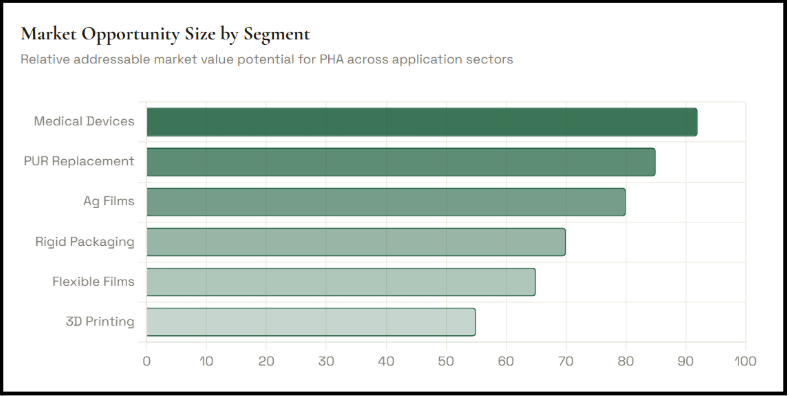
These niches can support early growth even when large-scale applications are cost-constrained.
4. Regulation and brand commitments are creating market pull
Global restrictions on single-use plastics continue to expand.
In parallel, many large brands have pledged to shift part of their packaging to certified compostable materials.
For PHA, this is an opportunity because it aligns well with stricter certification expectations (for compostability and biodegradation).
The key point is not that regulation will “force” PHA everywhere, but that it expands the number of product categories where PHA becomes a serious candidate.
7.2 Key Process Technologies Relevant to Current and Future Markets
Scaling PHA is not only about demand. It is mainly about process efficiency, mainly how the polymer is produced, recovered, and converted into finished products.
1. Next-Generation Industrial Biotechnology (NGIB)
Traditional fermentation relies on sterile conditions, which are expensive to build and operate. NGIB approaches use extremophiles (microorganisms that thrive in high-salt or other harsh conditions). This can enable:
The goal is simple: reduce the “biotech overhead” that keeps PHA expensive.
2. Copolymers, blending, and compounding to improve performance
Not all PHA types behave the same. Some, like PHB, can be stiff and brittle and can degrade near their processing temperatures. Two routes are commonly used to improve performance:
This is how PHA becomes workable for film, rigid packaging, and technical parts—not just specialty products.
3. Extraction and downstream processing improvements
Extraction and purification are major cost drivers, estimated at 30–50% of production cost.
There is a clear push toward:
This is not only a cost issue. It also protects the credibility of PHA’s environmental claim.
4. Use on existing plastics machinery (important for adoption speed)
PHA materials can be processed using mainstream conversion technologies, including:
Compatibility with existing equipment reduces adoption friction. It also helps converters trial PHA without rebuilding their plants.
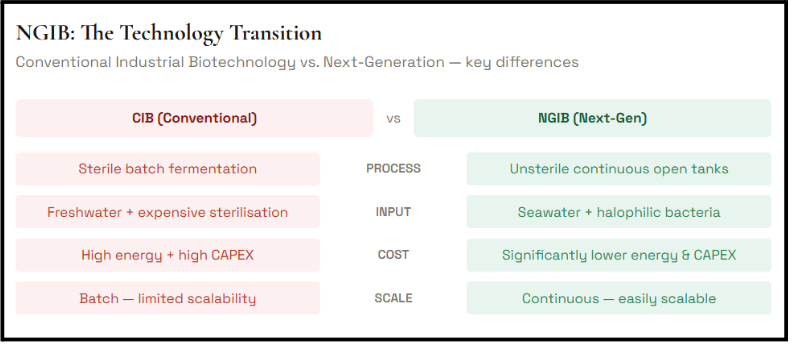
7.3 Challenges and Risks
PHA’s direction is promising, but there are real constraints that must be stated clearly.
1. Cost remains the biggest barrier
PHA is still typically 3–4 times more expensive per kg than commodity plastics like PE and PP.
The cost pressure comes from:
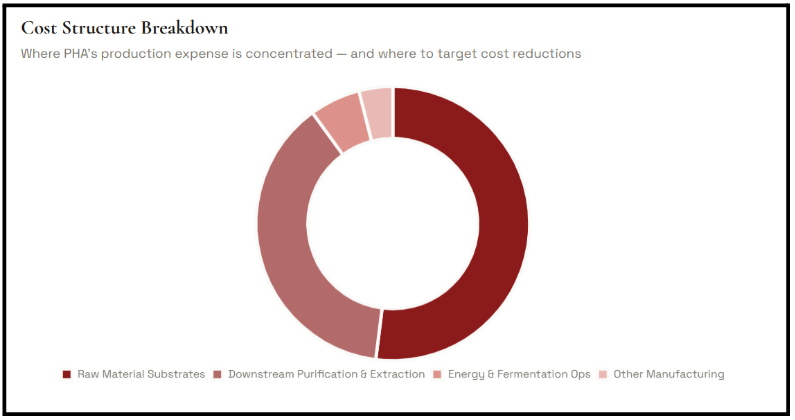
Until large plants are built and run reliably, PHA will stay concentrated in applications where buyers can justify the premium.
2. Material performance is not automatic
Some PHA grades have a narrow processing window and can be sensitive to heat. Others can be too stiff or brittle for flexible packaging unless modified.
This creates two practical risks:
In short: performance is solvable, but it often requires careful formulation, not “drop-in” substitution.
3. Scaling waste feedstocks is harder than it sounds
Waste-based feedstocks are attractive, but they are not uniform. Quality and consistency can vary due to:
If feedstock quality is unstable, polymer quality can become unstable. This is a serious commercial risk when customers need predictable material specs.
4. Environmental trade-offs must be managed honestly
PHA is biodegradable, but the full sustainability picture depends on how it is produced.
Two concerns are repeatedly raised:
The industry’s response is clear: cleaner extraction and better validation of real-world biodegradation outcomes.
5. Infrastructure and policy lag behind material innovation
Even a biodegradable plastic needs a clear disposal pathway. In many regions, composting infrastructure and local acceptance rules are inconsistent.
This leads to confusion and, in practice, diversion to landfill or incineration, which reduces the benefit PHAs are meant to provide.
7.4 Strategic Outlook
1. Growth is expected to be aggressive, but uneven
PHA capacity is projected to expand rapidly over the next few years. Some forecasts suggest PHAs could take a much larger share of total bioplastics capacity by the end of the decade.
However, growth will not be uniform across all grades or applications. Early expansion will concentrate where performance and policy demand are strongest.
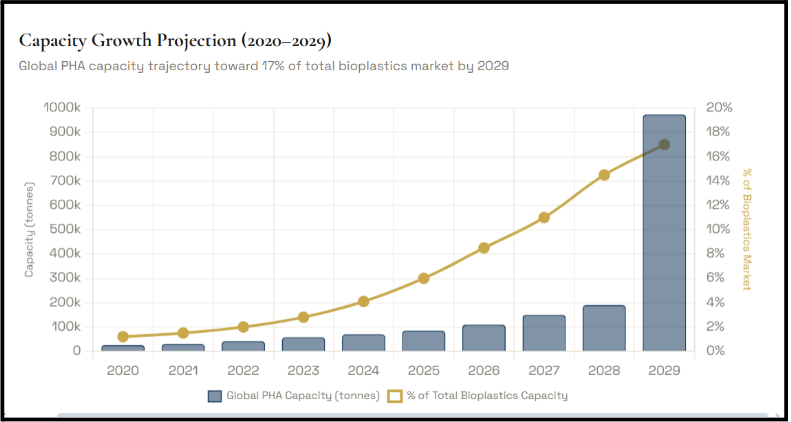
3. Partnerships will decide who reaches scaleBuilding 50,000+ ton plants requires capital, process expertise, and downstream market access. Strategic alliances between technology startups, large industrial operators, and brand owners are therefore not optional, they are the main route to scale.
4. Market leadership will split across regionsEurope remains strong in research and patent activity. Asia-Pacific, especially China, is scaling manufacturing capacity quickly. Other regions are also active, particularly where waste feedstock routes are being developed.The likely outcome is a global network of PHA hubs, each with different feedstocks and strengths.
7.5 What “success” looks like for PHA
PHA’s long-term role will be shaped by one question: can it deliver verified biodegradability and reliable economics at scale?References
General
China
India
Thailand
USA
Canada
Germany
UK
Italy
Australia
Brazil
Leaders
About the Authors
This report is a collective effort by the Ukhi Research Division, with support from our leadership team and technical experts.
Lead Authors:
Vishal Vivek
Co-founder & CEO
Email: vishal@ukhi.com
Contributors:
This work also benefited from contributions by Ukhi’s in-house research, commercial, and product teams.
For Further Inquiries
For questions, permissions, or requests related to this report or other Ukhi publications, please contact:
Research & Publications
Ukhi Bioplastics Private Limited
Email: info@ukhi.com
Phone: +91-96259 68232
Address: Plot -141, IMT Main Rd, Industrial Area, Sector 68, Faridabad, Haryana 121004, India
Website: www.ukhi.com
For media queries or speaking opportunities, please email Vishal Vivek (vishal@ukhi.com).
Note:
For the latest updates, product launches, or to connect with the authors, please visit www.ukhi.com or follow us on LinkedIn and other social media channels.