Bioplastics Opportunity Index Explorer
Browse, sort and compare 25 countries ranked by the commercial opportunity their single-use plastic bans create for bioplastics.
| Rank ↑ | Country | Region | P1 | P2 | P3 | Score |
|---|
Prepared by
Ukhi Research Division
Ukhi Bioplastics Private Limited
India
Report Highlights
- • A country-by-country ranking of where single-use plastic bans are creating the biggest commercial opportunities for bioplastics.
- • Assessments of 25 markets across 4 regions: Asia-Pacific, Europe, the Americas, the Middle East and Africa.
- • Explanation of how SUP bans work in practice globally — including direct bans, fiscal measures, EPR systems, phased rollouts, and voluntary models — and where the gap between regulation and reality is widest.
- • An analysis of where bans are genuinely creating bioplastics demand through compostable exemptions, structural recycling shortfalls, fiscal tipping points, feedstock advantages, and the EU’s 2026 PPWR harmonisation.
- • Strategic implications for bioplastics companies and investors, covering volume versus value market selection, feedstock positioning, fiscal forcing events, and policy reversal risk.
Publication Details
Publication Date: April 2026
Publisher: Ukhi Bioplastics Private Limited
Location: New Delhi, India
Report Period Covered: Regulatory and market data current as of Q1 2026
Data Last Updated: 23rd April, 2026
Countries Covered: 25 countries across 4 regions (Asia-Pacific, Europe, Americas, Middle East, Africa & Oceania)
Disclaimer
This report is based on data and information available from government gazettes, national environmental agencies, legislative databases, peer-reviewed research, credible industry sources (European Bioplastics, OECD, UNEP, World Bank), and verified trade publications as of March 2026.
Enforcement assessments draw on reported evidence including government compliance data, investigative journalism, and NGO assessments and involve informed judgment where hard data is unavailable.
While every effort has been made to ensure accuracy, Ukhi does not guarantee completeness in cases where official data is unpublished, inconsistent across sources, or unavailable for specific countries.
Scoring methodology is fully disclosed in the report and readers are invited to scrutinize individual country scores against the stated criteria. This report prioritizes factual integrity and transparency over speculative modelling.
Executive Summary
This report ranks 25 countries by the commercial opportunity their single-use plastic bans create for bioplastics — based on regulatory strength, enforcement reality, and the gap between plastic being removed and bioplastic supply available to replace it.
The Global SUP Ban-linked Bioplastics Opportunity Index 2026: Full Rankings
The Bioplastics Opportunity Index: At a Glance
The top 10 and bottom 5 countries from our full 25-country ranking:
🔺 Top 10 Markets
| Rank | Country | Region | Composite Score |
|---|---|---|---|
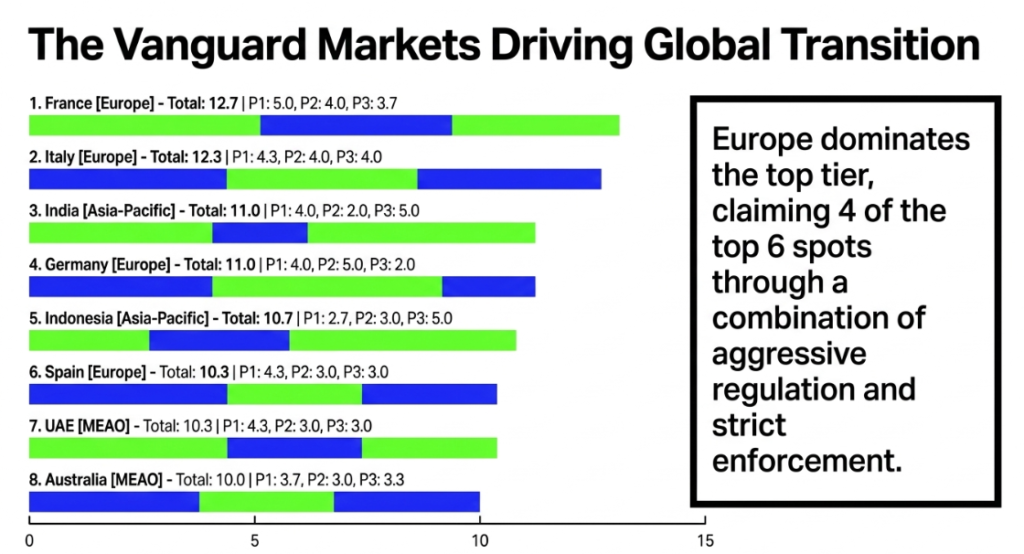
| 1 | France | Europe | 12.7 / 15 |
| 2 | Italy | Europe | 12.3 / 15 |
| 3 | India | Asia-Pacific | 11.0 / 15 |
| 4 | Germany | Europe | 11.0 / 15 |
| 5 | Indonesia | Asia-Pacific | 10.7 / 15 |
| 6 | Spain | Europe | 10.3 / 15 |
| 7 | UAE | MEAO | 10.3 / 15 |
| 8 | Australia | MEAO | 10.0 / 15 |
| 9 | United Kingdom | Europe | 9.7 / 15 |
| 10 | Colombia | Americas | 9.5 / 15 |
🔻 Bottom 5 Markets
| Rank | Country | Region | Composite Score |
|---|---|---|---|
| 21 | Kenya | MEAO | 8.0 / 15 |
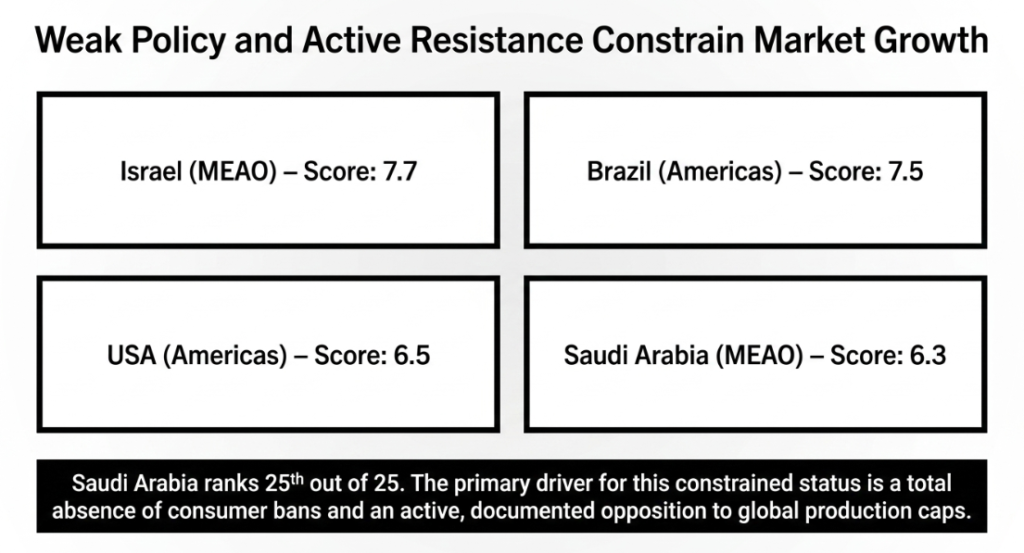
| 22 | Israel | MEAO | 7.7 / 15 |
| 23 | Brazil | Americas | 7.5 / 15 |
| 24 | USA | Americas | 6.5 / 15 |
| 25 | Saudi Arabia | MEAO | 6.3 / 15 |
The full 25-country ranking with pillar-level scores appears in Section 3.
Key Findings
1. Regulation and opportunity are inversely correlated in the countries that matter most
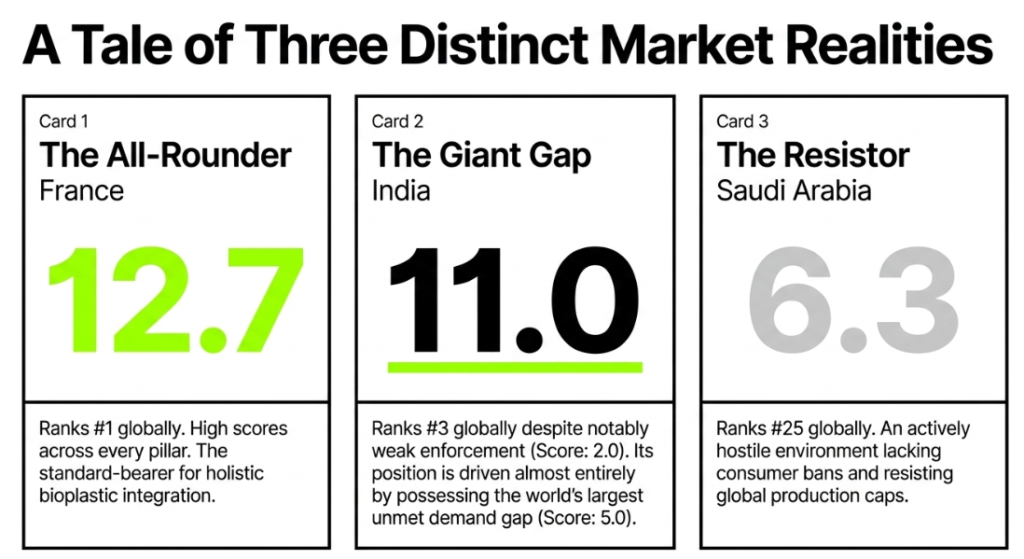
France has the world’s strongest SUP legislation but a moderate opportunity gap because European bioplastics suppliers already serve the market. India has the world’s largest unmet demand (Pillar 3: 5.0) but weak enforcement (Pillar 2: 2.0) limits the addressable market to the formal sector. So, the countries with the best regulation are not always the countries with the biggest supply gaps. This means bioplastics companies must choose: enter well-regulated, competitive markets, or target under-served markets where enforcement is the binding constraint.
2. Italy’s position as Europe’s #1 bioplastics market is under direct legal threat
Italy ranks second globally because of a unique compostable exemption that allows certified bioplastic cutlery, plates and cups to replace banned plastic equivalents, which creates 40-50% of EU bioplastics demand. The European Commission issued a formal infringement notice in July 2024 challenging this exemption. If Italy is forced to remove it, the foundation of a €704 million market could erode. The EU PPWR’s August 2026 application date is the likely resolution deadline. Any investment thesis built on Italian bioplastics demand must account for this risk.
3. Taxes and EPR fees are more reliable demand drivers than bans
The UK’s combined regulatory cost burden on virgin plastic packaging (~£650/tonne from pEPR and Plastic Packaging Tax) is creating stronger demand pull for alternatives than many countries with outright bans but weak enforcement. Spain’s €0.45/kg plastic tax and Colombia’s 17% IPUSUI surcharge work similarly. Fiscal mechanisms work through the tax system, which is harder to evade than a product ban. India’s escalating EPR targets through 2028-29 (60% recycled content for rigid packaging) will likely drive more volume bioplastics demand than the 2022 item ban itself.
4. Three forcing events will reshape the market before 2028
- • EU PPWR — August 2026. Harmonises SUP bans across 27 member states (450 million consumers), resolves the Italy exemption question, and transforms Europe from 27 separate regulatory stories into one market.
- • Emirates Biotech PLA plant — early 2028. At 160,000 TPA, the world’s largest single-site PLA facility. Reshapes Middle Eastern and African supply chains. Both a threat to current exporters and an opportunity for downstream converters.
- • India EPR recycled-content deadline — 2028-29. Forces every major FMCG brand, retailer and e-commerce company in India to restructure packaging procurement. This is where India’s volume bioplastics demand will actually materialize.
5. Policy reversal is a real and underpriced risk
This report documents regulatory reversals or significant pauses in six countries:
- • Israel (utensil tax repeal)
- • South Korea (cup ban withdrawal)
- • Netherlands (enforcement pause)
- • Saudi Arabia (partial oxo-degradable mandate suspension)
- • Kenya (EPR judicially suspended)
- • the USA (federal policy reversal via executive order)
These follow a common pattern of political backlash when bans impose visible costs on consumers or specific communities. Any market where bioplastics demand depends on a single regulatory provision carries concentration risk. The most resilient opportunities are in markets with multiple, reinforcing regulatory layers — like India (ban + EPR + traceability + recycled content mandates) or France (AGEC + EPR + PPWR).
About This Report
This report ranks 25 countries by the commercial opportunity their single-use plastic bans create for bioplastics companies, exporters and investors.
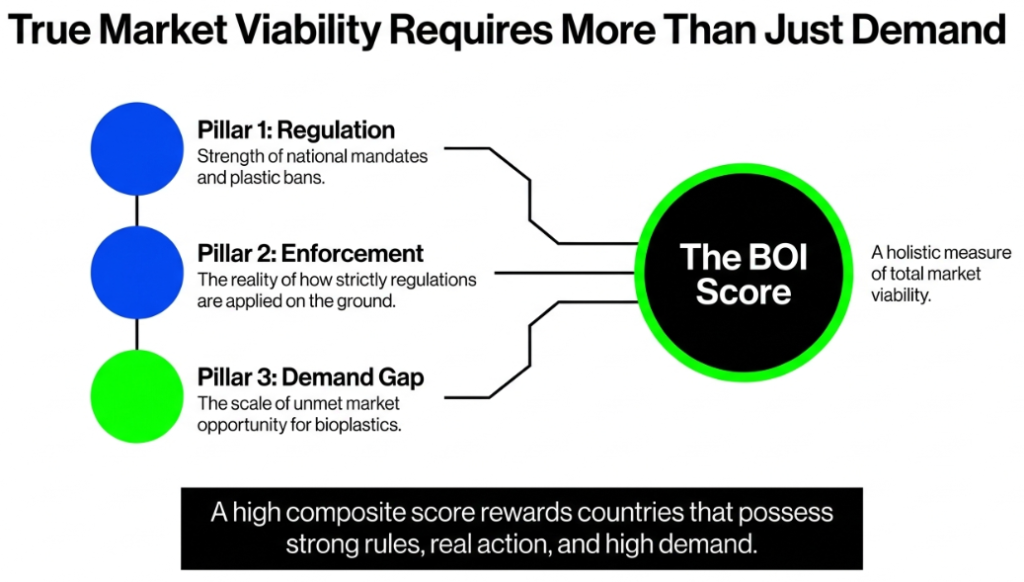
To make this ranking rigorous and comparable, we developed the Bioplastics Opportunity Index (BOI) — a composite scoring framework that rates each country across three dimensions: how strong its SUP regulation is, whether that regulation is actually enforced, and how large the unmet demand for bioplastic alternatives is.
Every country in this report is scored on the same scale, using the same criteria, so readers can compare any two markets at a glance. The methodology is fully disclosed in the next section and readers are invited to scrutinise individual scores against the stated criteria.
The report is published by Ukhi as a strategic reference for anyone evaluating where to sell, manufacture, invest in, or source bioplastics.
That includes:
- • bioplastics entrepreneurs,
- • packaging companies exploring material switches,
- • investors scanning the sector for geographic tailwinds,
- • sustainability consultants advising corporates on compliance,
- • policy researchers studying the plastics-to-bioplastics transition,
- • and trade bodies helping companies identify export markets.
All data is current as of Q1 2026 unless otherwise noted.
Regulatory information reflects enacted legislation and published enforcement data and disregards proposed bills, draft rules or announced intentions unless explicitly flagged.
How We Selected the 25 Countries In Scope For This Report
We considered four criteria:
- •
Regulatory action. The country must have enacted legislation restricting or banning single-use plastics, or imposing EPR/fiscal obligations on plastic packaging. - •
Market scale. The country must have a meaningful plastic consumption volume. - •
Regional representation. The report is positioned as a global index. It covers every major geography. We ensured no region was left out and that each region contains enough countries to show meaningful internal variation. - •
Diversity of regulatory approach. We deliberately included countries that use different regulatory tools such as outright bans (India, France, Kenya), fiscal measures (Spain, UK, Colombia), EPR-led systems (Australia, South Africa, California within the USA), voluntary models (Japan), and hybrid approaches (Germany, Canada).
The result is 25 countries across four regions:
- • Asia-Pacific (6): India, China, Indonesia, Japan, South Korea, Thailand
- • Europe (8): France, Germany, UK, Italy, Spain, Netherlands, Sweden, Denmark
- • Americas (5): USA, Canada, Brazil, Mexico, Colombia
- • Middle East, Africa & Oceania (6): Australia, Israel, UAE, Saudi Arabia, Kenya, South Africa
How the Bioplastics Opportunity Index (BOI) Works
The BOI measures one thing: how attractive is this country as a market for bioplastics, given its SUP regulation, enforcement and supply gap?
To do this, we rate each country on three criteria:
Pillar 1 — Regulatory Strength.
Pillar 2 — Enforcement Reality.
Pillar 3 — Market Opportunity Gap.
We score each country on a scale of 1 to 5 for each criteria, and then arrive at a composite score out of 15.
The index then ranks the countries.
The three criteria are explained here:
Pillar 1 — Regulatory Strength
This measures how strong and forward-looking the country’s SUP regulation is. Because regulation has multiple dimensions, this pillar is itself the average of three sub-scores:
1A — Legal Framework Robustness.
Does comprehensive legislation exist? Are penalties meaningful? Is there a clear enforcing body? A score of 1 means no formal legislation. A score of 5 means world-leading regulatory architecture.
1B — Ban Breadth.
How many product categories are actually banned? A score of 1 means only one category (usually bags). A score of 5 means virtually all SUP categories are covered including packaging.
1C — Future Trajectory.
Where is the regulation heading? A score of 1 means static or at risk of rollback. A score of 5 means ambitious, legally binding targets with near-term milestones.
Pillar 1 score = average of 1A + 1B + 1C, rounded to one decimal.
Pillar 2 — Enforcement Reality
A score assessing whether the ban is actually implemented on the ground. This is the hardest pillar to score objectively, but arguably the most important, because a country with perfect regulation and zero enforcement is a worse opportunity than one with a partial ban that’s strictly enforced.
- • 1 = virtually no enforcement, banned items freely sold
- • 2 = sporadic enforcement, mostly in capital cities or against large manufacturers
- • 3 = moderate enforcement, fines being issued but non-compliance still common
- • 4 = strong enforcement across the formal sector, compliance is the norm for businesses
- • 5 = strict and consistent enforcement with meaningful consequences, high compliance across both formal and informal sectors
Enforcement scoring draws on reported evidence such as news coverage, government compliance data, NGO assessments, and investigative journalism.
Pillar 3 — Market Opportunity Gap
This measures the distance between how much plastic is being removed by bans and how much bioplastics capacity exists to fill that gap. A large gap means high opportunity.
- • 1 = small gap — the country already has substantial domestic bioplastics production and import channels
- • 2 = moderate gap — some supply exists but doesn’t fully cover demand
- • 3 = significant gap — large plastic consumption, limited bioplastics supply, heavy import reliance
- • 4 = large gap — very limited bioplastics presence despite active bans
- • 5 = massive gap — very high plastic consumption being disrupted by bans, almost no domestic bioplastics capacity
Composite Score
Composite = Pillar 1 + Pillar 2 + Pillar 3. Range: 3 to 15.
How the Report Is Organised
Countries are grouped by region — Asia-Pacific, Europe, Americas, and Middle East, Africa & Oceania. Within each region, countries are ordered by composite score from highest to lowest, not alphabetically. This means the strongest opportunities appear first in each regional section.
Global Overview of Single-Use Plastic Bans
1.1 The Global Landscape: How Single-Use Plastic Bans Are Reshaping Markets
Every ban on single-use plastic creates a vacuum. The product disappears but the demand doesn’t. People still need bags, cups, cutlery and packaging. What changes is the material. That shift is the commercial opportunity this report attempts to map.
But to understand where the opportunity is biggest, you need to understand what’s actually happening with SUP bans worldwide.
How Countries Are Regulating Single-Use Plastics
Plastic bans are not moving in one direction globally, but are splintering, as some countries accelerate, others reverse, and the gap between law and enforcement is often enormous. Most countries use a combination of these five approaches:
1. Direct Product Bans
A law prohibiting specific items from being manufactured, imported, sold or used. This is the most common approach, and is used by India, France, Kenya, Canada, the UAE and most EU countries.
The scope varies hugely. France bans fruit-and-vegetable packaging, fast-food dine-in disposables and plastic toys in kids’ meals. India bans 14 specific items plus carry bags below 120 microns. Kenya bans all carrier bags but not cups or cutlery outside national parks.
2. Fiscal Pressure
Taxing conventional plastic rather than banning it and making alternatives price-competitive through cost signals rather than prohibition.
- • Spain: €0.45/kg on non-recycled plastic packaging
- • UK: £224/tonne Plastic Packaging Tax + £423/tonne EPR fee — combined, among the highest regulatory cost burdens on virgin plastic anywhere
- • Colombia: IPUSUI tax adds ~17% to rigid plastic container costs
- • Japan and Israel: Mandatory bag charges that cut consumption by ~70%
Insight: Fiscal signals don’t remove plastic from the market. But they’re more effective than poorly enforced bans because they work through the tax system, which is harder to evade.
3. Extended Producer Responsibility (EPR)
Requiring companies that put plastic packaging on the market to pay for its collection and recycling. This doesn’t ban anything directly but restructures packaging economics so bio-based materials become financially attractive.
California’s SB 54, South Africa’s Section 18, and India’s escalating recycled-content mandates (30% for rigid packaging in 2025-26, rising to 60% by 2028-29) all work this way.
4. Phased Rollouts
Bans that start with easy items and progressively expand. The phase schedule tells businesses exactly when the next wave of demand will arrive.
- • China: Geographic tiers — major cities first, then smaller ones
- • Colombia: Two phases through 2030 — bags and straws first, then food containers and cutlery
- • UAE: Bags in 2024, then cups, cutlery and Styrofoam in 2026
5. Voluntary and Market-Based Models
Reduction through disclosure, reputation and corporate pressure rather than legal prohibition.
Japan has no law banning any single-use plastic item. Its Plastic Resource Circulation Act uses mandatory charging, public reporting and industry cooperation. The bag charge alone cut usage ~70%.
Caveat: Voluntary models can reduce consumption significantly but don’t create the hard demand floor that a legal ban does. For bioplastics suppliers, mandatory bans are a more reliable demand signal.
1.2 The Reputation-Versus-Reality Problem
A critical finding from our research: the relationship between how strict a ban looks on paper and how much demand it actually creates is weak.
Three patterns explain why.
Strong law, weak enforcement
Kenya’s 2017 bag ban carries up to 4 years’ imprisonment. But cross-border smuggling is endemic, enforcement has softened, and Nairobi’s governor publicly acknowledged in 2024 that bags “have come back.” In India, a Toxics Link study found 64% of market sites still had banned plastics a year after the ban.
Policy reversal
Israel repealed a utensil tax that had cut consumption 40%, to fulfil coalition demands. South Korea withdrew its paper cup ban indefinitely. The Netherlands paused SUP surcharge enforcement. The US reversed federal plastics policy via executive order. These follow a common pattern: political backlash when bans impose visible costs on consumers.
Ban without alternatives
Some countries ban plastic but lack the supply chain, composting infrastructure or certification systems to make bioplastics viable. The ban pushes demand to paper, cloth or non-compliance, not to bioplastics.
Key takeaway: A ban only creates a bioplastics opportunity to the extent it is actually enforced and alternatives are available and affordable.
1.3 Where Single-Use-Plastic Bans Are Creating Real Opportunities
Amid this complexity, five patterns stand out where SUP regulation is genuinely creating commercial demand for bioplastics.
The Exemption Effect
The most powerful mechanism: ban conventional plastic but explicitly exempt certified compostable alternatives. Italy did this, and went on to create Europe’s largest bioplastics market (40-50% of EU demand) and the foundation for Novamont’s 150,000 TPA operation. The UAE similarly recognises PLA as a permitted substitute.
Structural Recycling Shortfalls
Australia faces a 64% gap between waste volumes and recycling capacity. Domestic virgin polymer production has nearly exited. When a country can neither recycle nor produce enough conventional plastic, bio-based alternatives fill a structural need.
Fiscal Tipping Points
When the combined regulatory cost on conventional plastic exceeds the bioplastics price premium, substitution becomes economically rational without any ban. The UK is approaching this: ~£650/tonne in combined regulatory costs before manufacturing begins.
Feedstock-Driven Cost Advantage
Local agricultural feedstocks make bioplastics cheaper in certain geographies. Examples:
- • Indonesia’s cassava and seaweed
- • Thailand’s sugar and cassava (with 8-year tax holidays for bioplastic projects)
- • Brazil’s sugarcane ethanol powering Braskem’s 275,000 TPA bio-PE — the world’s largest
The 2026 EU Harmonisation Event
The Packaging and Packaging Waste Regulation (PPWR), entering application in August 2026, will impose uniform bans on fruit-and-veg packaging, HORECA dine-in disposables, hotel toiletries and condiment sachets across all 27 EU member states.
It transforms the opportunity from navigating 27 separate regimes to serving a single harmonised market of 450 million consumers. This makes PPWR the most important regulatory event for European bioplastics before 2030.
The Bioplastics Opportunity Index: Full 25-Country Rankings
The table below ranks all 25 countries assessed in this report by their BOI composite score. Countries are grouped by region in the detailed assessments that follow, but here they are presented in a single ranked list for direct comparison.
🟢 High Opportunity (10.0+)
| Rank | Country | Region | Pillar 1 | Pillar 2 | Pillar 3 | Composite |
|---|---|---|---|---|---|---|
| 1 | France | Europe | 5.0 | 4.0 | 3.7 | 12.7 |
| 2 | Italy | Europe | 4.3 | 4.0 | 4.0 | 12.3 |
| 3 | India | Asia-Pacific | 4.0 | 2.0 | 5.0 | 11.0 |
| 4 | Germany | Europe | 4.0 | 5.0 | 2.0 | 11.0 |
| 5 | Indonesia | Asia-Pacific | 2.7 | 3.0 | 5.0 | 10.7 |
| 6 | Spain | Europe | 4.3 | 3.0 | 3.0 | 10.3 |
| 7 | UAE | MEAO | 4.3 | 3.0 | 3.0 | 10.3 |
| 8 | Australia | MEAO | 3.7 | 3.0 | 3.3 | 10.0 |
🟡 Moderate Opportunity (8.0–9.9)
| Rank | Country | Region | Pillar 1 | Pillar 2 | Pillar 3 | Composite |
|---|---|---|---|---|---|---|
| 9 | United Kingdom | Europe | 3.7 | 3.0 | 3.0 | 9.7 |
| 10 | Colombia | Americas | 4.5 | 3.0 | 2.0 | 9.5 |
| 11 | China | Asia-Pacific | 3.3 | 3.0 | 3.0 | 9.3 |
| 12 | Netherlands | Europe | 3.3 | 2.0 | 4.0 | 9.3 |
| 13 | Japan | Asia-Pacific | 3.0 | 4.0 | 2.0 | 9.0 |
| 14 | Sweden | Europe | 3.7 | 4.0 | 1.3 | 9.0 |
| 15 | South Korea | Asia-Pacific | 2.7 | 3.0 | 3.0 | 8.7 |
| 16 | Denmark | Europe | 3.7 | 3.0 | 2.0 | 8.7 |
| 17 | Thailand | Asia-Pacific | 2.3 | 2.0 | 4.0 | 8.3 |
| 18 | South Africa | MEAO | 3.3 | 3.0 | 2.0 | 8.3 |
| 19 | Mexico | Americas | 3.2 | 2.0 | 3.0 | 8.2 |
| 20 | Canada | Americas | 3.5 | 2.5 | 2.0 | 8.0 |
| 21 | Kenya | MEAO | 3.0 | 2.0 | 3.0 | 8.0 |
🔴 Emerging / Constrained Opportunity (below 8.0)
| Rank | Country | Region | Pillar 1 | Pillar 2 | Pillar 3 | Composite |
|---|---|---|---|---|---|---|
| 22 | Israel | MEAO | 2.0 | 2.7 | 3.0 | 7.7 |
| 23 | Brazil | Americas | 2.5 | 2.0 | 3.0 | 7.5 |
| 24 | USA | Americas | 2.5 | 2.0 | 2.0 | 6.5 |
| 25 | Saudi Arabia | MEAO | 1.3 | 2.0 | 3.0 | 6.3 |
How to read this table: A high Pillar 1 score means strong regulation. A high Pillar 2 means the regulation is actually enforced. A high Pillar 3 means there is a large unmet demand gap for bioplastics. The composite rewards countries that are strong across all three. France leads because it scores high everywhere. India ranks third despite weak enforcement because its opportunity gap is the largest in the world. Saudi Arabia ranks last because it has no consumer ban and actively opposes global production caps.
The Bioplastics Opportunity Index: 25-Country Assessment
The following is a country-by-country evaluation of 25 markets across four regions. Each is scored on the same three-pillar framework and presented in a consistent format so any two countries can be compared at a glance. Within each region, countries are ordered by composite score from highest to lowest.
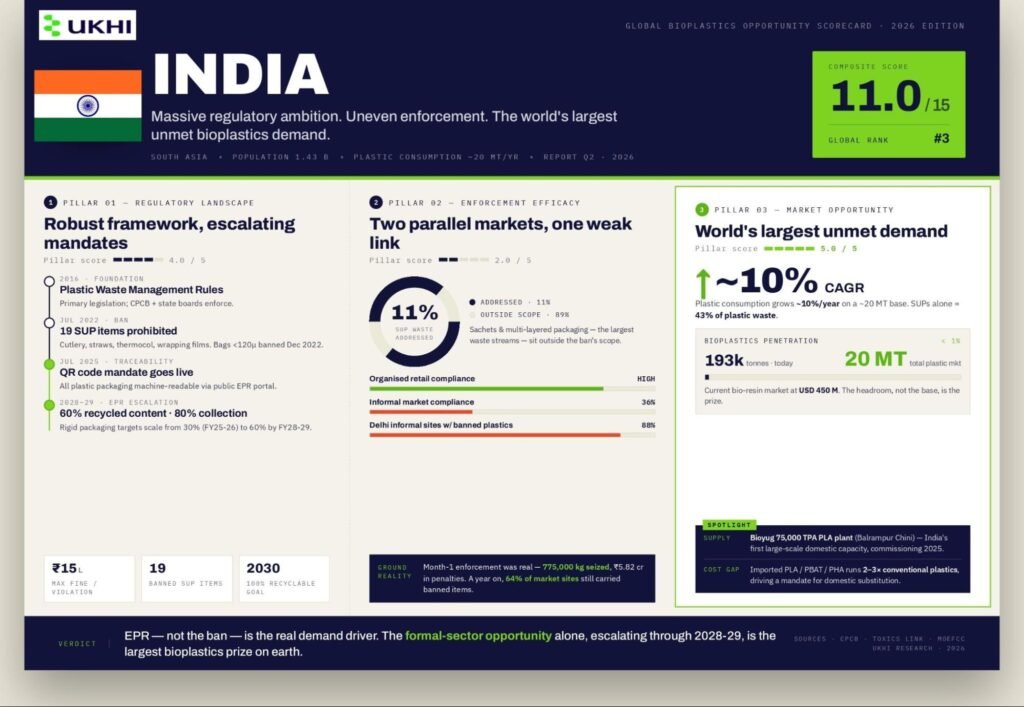
3.1 INDIA – Single-Use Plastic Ban: Market Opportunity Index
Composite Score: 11.0 / 15 | Global Rank: #3
Massive regulatory ambition and the world’s largest unmet bioplastics demand, but held back by enforcement gaps in the informal economy.
3.1.1 India’s Single-Use Plastic Ban: Laws and Regulations
3.1.1.1 Key Laws Governing India’s Plastic Ban
- • Primary legislation: The Plastic Waste Management Rules, 2016, amended significantly in 2021 (banning 19 SUP items), 2022 (EPR guidelines), 2025 (QR code traceability), and 2026 (escalated recycled content mandates).
- • Enforcing bodies: Central Pollution Control Board (CPCB) at national level, State Pollution Control Boards at state level, Urban Local Bodies on the ground.
- • Penalties for non-compliance: Fines up to ₹15 lakh per violation under the Environment (Protection) Act, 1986. Environmental compensation of ₹5,000–20,000 per tonne of banned items. Prosecution and factory closure for repeat offenders.
3.1.1.2 Which Plastic Items Are Banned in India?
19 banned items (from 1 July 2022): Earbuds, balloon sticks, flags, candy sticks, ice-cream sticks, thermocol for decoration, plates, cups, glasses, forks, spoons, knives, straws, trays, wrapping films around sweet boxes, invitation cards, cigarette packets, PVC banners under 100 microns, and stirrers.
Plastic carry bags below 120 microns banned since December 2022. Plastic sachets for gutkha and tobacco are completely prohibited.
Exemptions: Compostable plastics certified to IS/ISO 17088:2021, export-oriented SEZ units, and flexible food packaging (covered under EPR instead).
3.1.1.3 India’s Plastic Ban Timeline and Future Goals
- • Phase 1 (Jan 2022): Smaller items like earbuds, candy sticks, balloon sticks.
- • Phase 2 (Jul 2022): Larger categories like plates, cups, cutlery, straws, wrapping films.
- • EPR targets through 2028-29: Rigid packaging must include 30% recycled content in 2025-26, rising to 60% by 2028-29. Collection targets reach 80%. Reuse targets for large water containers reach 85%.
- • From July 2025: All plastic packaging must carry QR codes or barcodes for traceability.
Stated goal: 100% recyclable or compostable packaging by 2030.
3.1.2 India’s Plastic Ban Enforcement: Ground Reality
- • Organised retail broadly complies. In the ban’s first month, 775,000 kg of illegal plastics seized and ₹5.82 crore collected in penalties.
- • Informal markets remain non-compliant. A Toxics Link study found 64% of market sites still had banned plastics a year post-ban, with Delhi at 88%.
- • Scope is limited. The 19-item ban addresses only ~11% of India’s SUP waste. Sachets and multi-layered packaging remain outside scope.
- • Digital enforcement tightening. Over 100,000 entities received show-cause notices for EPR non-compliance in FY 2023-24.
3.1.3 India’s Bioplastics Market Size and Opportunity Gap
- • Plastic consumption: ~20 million tonnes annually, growing at ~10%/year.
- • Bioplastics market: ~USD 450 million (2024), ~193,000 tonnes — under 1% of total use.
- • Domestic capacity: Fragmented. Balrampur Chini (75,000 TPA PLA) is the largest addition.
- • Import dependence: High. PLA (Thailand/USA), PBAT (Germany/China), PHA (South Korea).
3.1.4 Commentary and Insights
- • EPR is the bigger demand driver than the ban itself.
- • Two parallel markets exist: formal vs informal economy.
- • Composting infrastructure is the critical gap.
3.1.5 India Opportunity Scorecard
| Factor | Score |
| Pillar 1: Regulatory Strength | 4.0 / 5 |
| 1A — Legal Framework | 4 |
| 1B — Ban Breadth | 4 |
| 1C — Future Trajectory | 4 |
| Pillar 2: Enforcement | 2 / 5 |
| Pillar 3: Opportunity Gap | 5 / 5 |
| Composite Score | 11.0 / 15 |
Verdict: India offers the world’s largest bioplastics opportunity by scale. Enforcement is the drag, but the formal sector opportunity alone is substantial and growing as EPR mandates tighten through 2028-29.
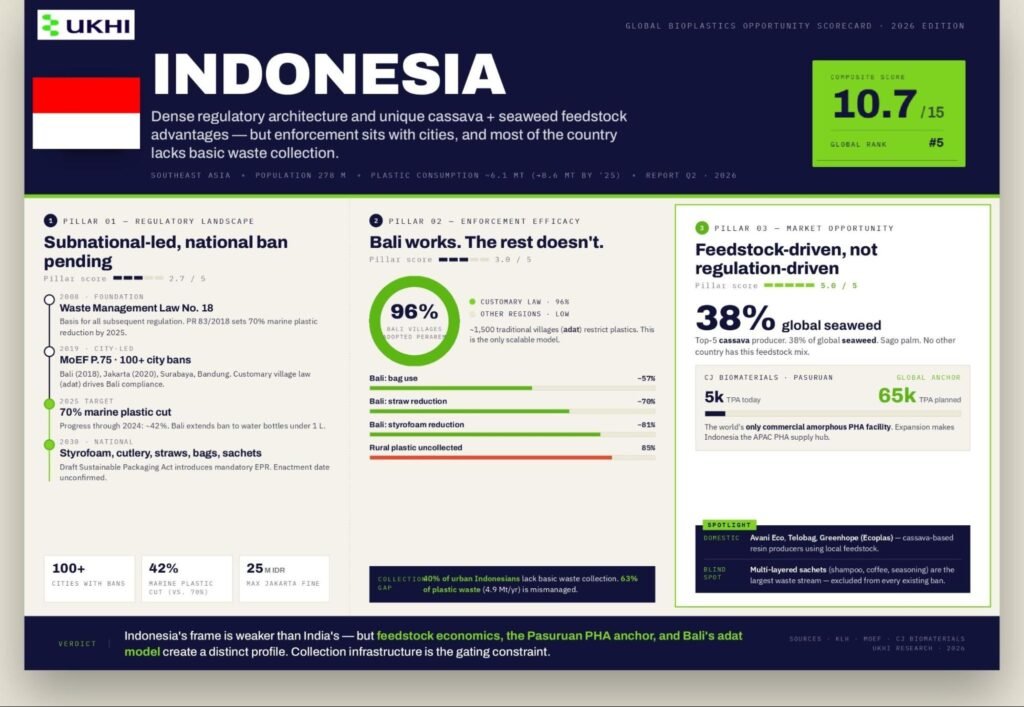
3.2 INDONESIA – Single-Use Plastic Ban: Market Opportunity Index
Composite Score: 10.7 / 15 | Global Rank: #5
Dense regulatory architecture and unique feedstock advantages in cassava and seaweed, but enforcement is delegated to cities, and most of the country lacks basic waste collection.
3.2.1 Indonesia’s Single-Use Plastic Ban: Laws and Regulations
3.2.1.1 Key Laws Governing Indonesia’s Plastic Ban
- • National framework: Law No. 18/2008 on Waste Management sets the foundation. Presidential Regulation No. 83/2018 established the National Action Plan on Marine Plastic Debris with a 70% marine plastic reduction target by 2025.
- • EPR regulation: MoEF Regulation P.75/2019 requires producers to cut baseline waste by 30% by 2029 and schedules a national ban on Styrofoam food packaging, plastic cutlery, straws, shopping bags, and sachet packaging by 2030.
- • Enforcing bodies: Coordinating Ministry for Maritime and Investment Affairs, Ministry of Environment (KLH), and provincial/city governments.
- • Penalties: Vary by jurisdiction. Jakarta fines range from IDR 5–25 million (~USD 300–1,500). National-level penalties are rarely applied.
3.2.1.2 Which Plastic Items Are Banned in Indonesia?
No nationwide product-specific SUP ban exists. Indonesia relies on subnational regulations, as roughly 100+ cities and regencies have enacted their own rules.
- • Bali: Bans SUP bags, Styrofoam, straws, and now plastic bottles under 1 litre.
- • Jakarta: Bans plastic shopping bags since July 2020.
- • Other cities: Bogor, Bandung, Surabaya, Semarang, Banjarmasin, Balikpapan, Denpasar, Makassar.
Exemptions: Medical packaging, industrial wrapping. Sachets remain unregulated nationally.
3.2.1.3 Indonesia’s Plastic Ban Timeline and Future Goals
- • 2025 target: 70% marine plastic reduction (progress ~42% by 2024).
- • 2030 target: National ban on Styrofoam, cutlery, straws, bags, and sachets.
- • Draft Sustainable Packaging Act under development (EPR expansion expected).
3.2.2 Indonesia’s Plastic Ban Enforcement: Ground Reality
- • Bali success: Plastic bags down 57%, straws 70%, Styrofoam 81%, strong village-level enforcement.
- • Jakarta mixed: Retail complies, but sachets untouched.
- • Infrastructure gap: 40% urban population lacks waste collection, 85% rural waste uncollected.
3.2.3 Indonesia’s Bioplastics Market Size and Opportunity Gap
- • Plastic consumption: ~6.1 Mt (2020), projected ~8.6 Mt by 2025.
- • Waste: ~7.8 Mt/year, 63% mismanaged.
- • Bioplastics capacity: CJ Biomaterials PHA plant (5,000 → 65,000 TPA planned).
- • Feedstock advantage: Cassava, seaweed (~38% global output).
Import dependence remains high for PLA and PBAT. :contentReference[oaicite:0]{index=0}
3.2.4 Commentary and Insights
- • Opportunity is feedstock-driven, not regulation-driven.
- • Subnational enforcement (Bali model) is key.
- • Sachets remain the largest unresolved waste category.
- • CJ Biomaterials positions Indonesia as a regional PHA hub.
3.2.5 Indonesia Opportunity Scorecard
| Factor | Score |
| Pillar 1: Regulatory Strength | 2.7 / 5 |
| Pillar 2: Enforcement Reality | 3 / 5 |
| Pillar 3: Opportunity Gap | 5 / 5 |
| Composite Score | 10.7 / 15 |
Verdict: Indonesia’s regulatory framework is weaker, but feedstock advantages and PHA capacity create a unique opportunity. Infrastructure remains the key constraint.
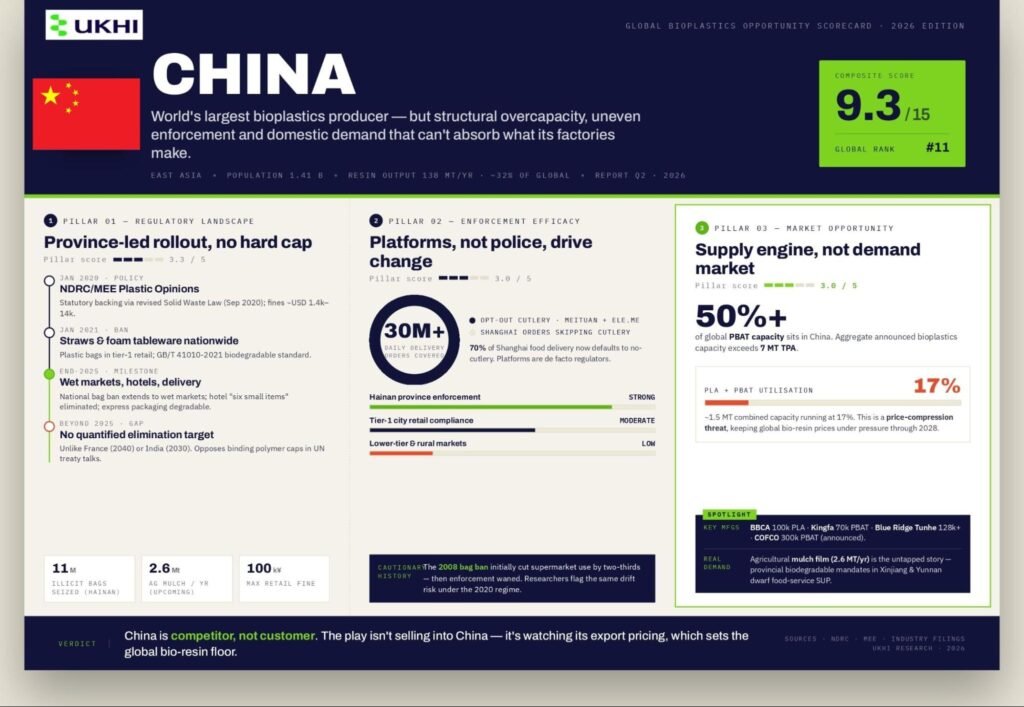
3.3 CHINA – Single-Use Plastic Ban: Market Opportunity Index
Composite Score: 9.3 / 15 | Global Rank: #11
The world’s largest bioplastics producer but with structural overcapacity, uneven enforcement, and domestic demand that cannot absorb what its factories make.
3.3.1 China’s Single-Use Plastic Ban: Laws and Regulations
3.3.1.1 Key Laws Governing China’s Plastic Ban
- • Primary policy: The NDRC/MEE “Opinions on Further Strengthening Plastic Pollution Treatment” (January 2020).
- • Statutory backing: The revised Solid Waste Law (effective September 2020). Article 69 prohibits production, sale, and use of non-degradable SUPs. Article 106 penalties: RMB 10,000–100,000 (~USD 1,400–14,000) for retail violations.
- • Implementation plan: The 14th Five-Year Plan Action Plan for Plastic Pollution Control (September 2021) operationalises province-level rollout.
- • Biodegradable standard: GB/T 41010-2021 (June 2022) requires ≥90% biodegradation and mandates the “双J” identification mark.
- • Strictest jurisdiction: Hainan Province — island-wide ban on all non-degradable SUPs from December 2020, with 11 million illicit bags seized at ports by end-2021.
3.3.1.2 Which Plastic Items Are Banned in China?
- • Plastic bags: Banned in tier-1 city retail from end-2020, all prefecture-level cities by end-2022, wet markets nationally by end-2025.
- • Straws and foam tableware: Disposable plastic straws banned nationwide in catering from January 2021. Foam tableware banned nationwide.
- • Food delivery cutlery: 30% reduction target by 2025 in tier-1+ cities.
- • Hotels: “Six small items” (toothbrushes, combs, razors etc.) restricted in star-rated hotels by 2022, all hotels by end-2025.
- • Microbeads: Production banned by end-2020, sales by end-2022.
- • Express delivery packaging: Required to be fully degradable in seven coastal provinces by end-2022, nationally by end-2025.
3.3.1.3 China’s Plastic Ban Timeline and Future Commitments
- • End-2025 deadlines were the key milestone: wet market bag bans go national, hotel single-use items eliminated, express packaging goes degradable.
- • No quantified long-term elimination target comparable to France’s 2040 or India’s 2030 ambitions.
- • Agricultural mulch film (2.6 Mt/year) — mandates for biodegradable mulch in provinces like Xinjiang and Yunnan represent a massive upcoming use case.
UN Plastics Treaty position: China sits in the Like-Minded Countries bloc, opposing binding polymer production caps.
3.3.2 China’s Plastic Ban Enforcement: Ground Reality
- • Province-level variation is extreme. Hainan enforces regulations with port seizures. Tier-1 cities show moderate retail compliance. Lower-tier and rural markets are largely unaffected.
- • Platforms, not police, drive compliance. Meituan and Ele.me cutlery opt-out systems cover 30M+ daily orders. Over 70% of Shanghai food delivery orders now skip cutlery. Platforms are de facto regulators.
- • The historical pattern is cautionary. The 2008 bag ban initially cut supermarket bag use by two-thirds, then enforcement waned. Researchers flag the same risk with the 2020 regime.
3.3.3 China’s Bioplastics Market Size and Capacity
- • Plastic consumption: World’s largest — 138 million tonnes of resin produced (2023), ~32% of global output. Plastic waste: 81.5 million tonnes (2022).
- • Bioplastics capacity: ~20% of global installed capacity. Over 50% of global PBAT capacity. Combined PLA+PBAT at ~1.5 Mt but running at only 17% utilisation.
Key manufacturers:
- • Kingfa (70,000 TPA PBAT)
- • BBCA Biochemical (100,000 TPA PLA)
- • Blue Ridge Tunhe (128,000+ TPA PBAT+PBS)
- • COFCO (300,000 TPA PBAT announced)
Aggregate announced capacity exceeds 7 million TPA.
Net exporter. China is the primary bio-resin supply source for India, Southeast Asia, and Europe. This is not a supply-gap market but a demand-gap market. :contentReference[oaicite:0]{index=0}
3.3.4 Commentary and Insights
China is a price-compression threat, not an entry opportunity. With PLA+PBAT capacity at 17% utilisation and millions of tonnes announced, Chinese overcapacity will keep global bio-resin prices under pressure through 2028.
Agricultural mulch film is the real demand story. At 2.6 Mt/year of plastic mulch (much left in soil), government mandates for biodegradable mulch represent a far larger addressable market than food service SUP replacement.
Platform-driven compliance is unique. The most effective SUP reduction has happened through Meituan and Ele.me’s opt-out defaults. This suggests that the bioplastics opportunity in China lies in B2B partnerships with delivery and e-commerce platforms, not retail substitution via ban enforcement.
3.3.5 China Opportunity Scorecard
| Factor | Score |
| Pillar 1: Regulatory Strength | 3.3 / 5 |
| 1A — Legal Framework Robustness | 4 |
| 1B — Ban Breadth | 3 |
| 1C — Future Trajectory | 3 |
| Pillar 2: Enforcement Reality | 3 / 5 |
| Pillar 3: Market Opportunity Gap | 3 / 5 |
| Composite Score | 9.3 / 15 |
Verdict: China has the world’s strongest bioplastics manufacturing base but weak demand absorption. Its capacity vastly outstrips what enforcement currently pulls through. The opportunity is not selling into China but watching its export pricing, which sets the floor for global bio-resin costs.
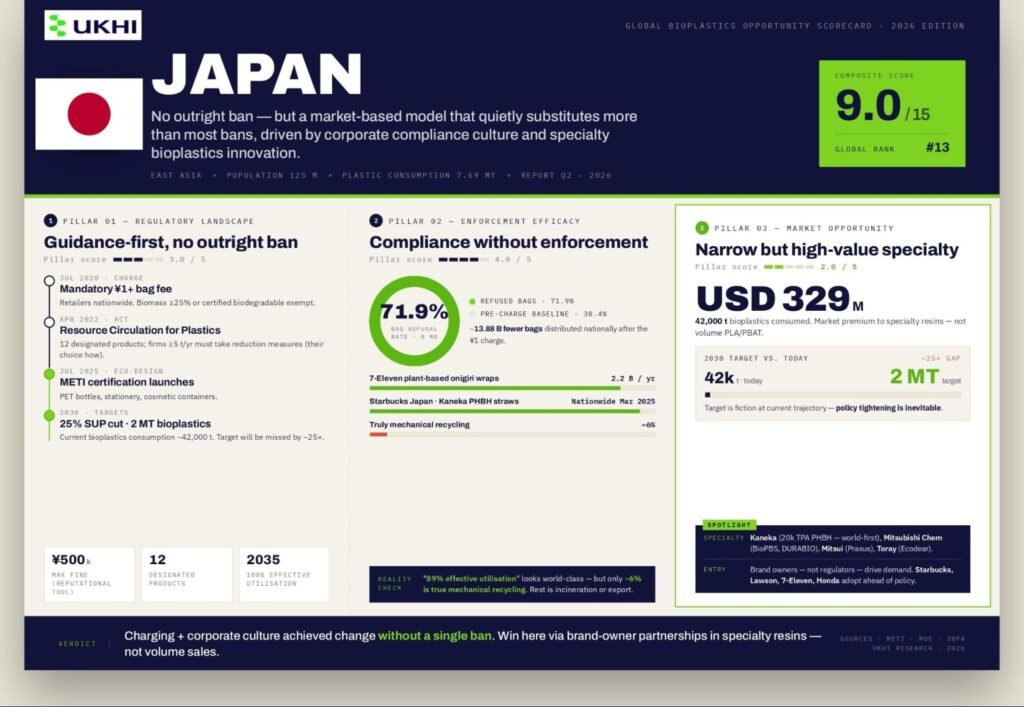
3.4 JAPAN – Single-Use Plastic Ban: Market Opportunity Index
Composite Score: 9.0 / 15 | Global Rank: #13
No outright ban but a market-based model that quietly achieves more substitution than most bans, driven by corporate compliance culture and specialty bioplastics innovation.
3.4.1 Japan’s Single-Use Plastic Reduction: Laws and Regulations
3.4.1.1 Key Laws Governing Japan’s Plastic Policy
- • Primary legislation: Act on Promotion of Resource Circulation for Plastics (2021, enforced April 2022). Administered by METI and Ministry of the Environment.
- • Bag charge (July 2020): Mandatory ≥¥1 fee at all retailers. Bags with ≥25% biomass content or certified biodegradable are exempt.
- • Compliance model: Guidance → recommendation → public disclosure → order → fine up to ¥500,000 (~USD 3,300). Reputational pressure, not heavy penalties.
3.4.1.2 Which Plastic Items Are Restricted in Japan?
No items are outright banned. The 2022 Act designates 12 products (forks, spoons, knives, stirrers, straws, hairbrushes, combs, razors, toothbrushes, shower caps, hangers, laundry covers) — businesses providing ≥5 tonnes/year must take reduction measures. They choose their own approach: charging, lightweighting, or switching to biomass materials.
3.4.1.3 Japan’s Plastic Reduction Timeline and Future Goals
- • July 2025: METI launches eco-design certification for PET bottles, stationery, cosmetic containers.
- • 2030: 25% SUP reduction, 60% packaging recycling, aspirational 2 Mt bioplastic introduction (current consumption: ~42,000 tonnes — target will be missed by 25×).
- • 2035: 100% effective utilization of waste plastic.
3.4.2 Japan’s Plastic Ban Enforcement: Ground Reality
- • Bag charge works. Refusal rates rose from 30.4% to 71.9% within eight months. ~13.88 billion fewer bags distributed nationally.
- • Corporate compliance is extensive without enforcement. 7-Eleven’s plant-based onigiri wraps cover 2.2 billion rice balls/year. Starbucks Japan rolled out Kaneka PHBH straws nationwide by March 2025.
- • Recycling figures are misleading. 89% “effective utilisation” claimed, but only ~6% is truly mechanically recycled. Rest is incineration or export.
3.4.3 Japan’s Bioplastics Market Size and Manufacturers
- • Plastic consumption: 7,690 kt (2023). Bioplastics: ~42,000 tonnes consumed, valued ~USD 329 million.
- • Key manufacturers: Kaneka (20,000 TPA PHBH — world’s first commercial PHBH), Mitsubishi Chemical (BioPBS, DURABIO bio-PC), Mitsui Chemicals (Prasus™), Toray (Ecodear).
- • Import dependent for commodity PLA/bio-PE. Domestic focus is specialty high-margin materials (PHA, bio-PC, bio-PBS).
3.4.4 Commentary and Insights
- • Japan proves bans are not the only path. Charging plus corporate culture achieved sustained change without a single ban.
- • Opportunity is specialty, not commodity. Japanese manufacturers lead in PHBH, bio-PBS, bio-PC. Volume PLA/PBAT competition is ceded to China and Thailand.
- • Brand owners drive demand, not regulators. Starbucks, Lawson, 7-Eleven, Honda adopt bioplastics faster than policy requires. Supplier opportunity is through brand partnerships.
- • The 2 Mt target is fiction. At 42,000 tonnes actual vs. 2 Mt target, policy tightening is inevitable.
3.4.5 Japan Opportunity Scorecard
| Factor | Score |
| Pillar 1: Regulatory Strength | 3.0 / 5 |
| 1A — Legal Framework Robustness | 3 |
| 1B — Ban Breadth (product categories) | 2 |
| 1C — Future Trajectory | 4 |
| Pillar 2: Enforcement Reality | 4 / 5 |
| Pillar 3: Market Opportunity Gap | 2 / 5 |
| Composite Score | 9.0 / 15 |
Verdict: Narrow but high-value market. Not a volume market but a premium market where brand-owner partnerships and specialty material innovation determine who wins.
3.5 SOUTH KOREA – Single-Use Plastic Ban: Market Opportunity Index
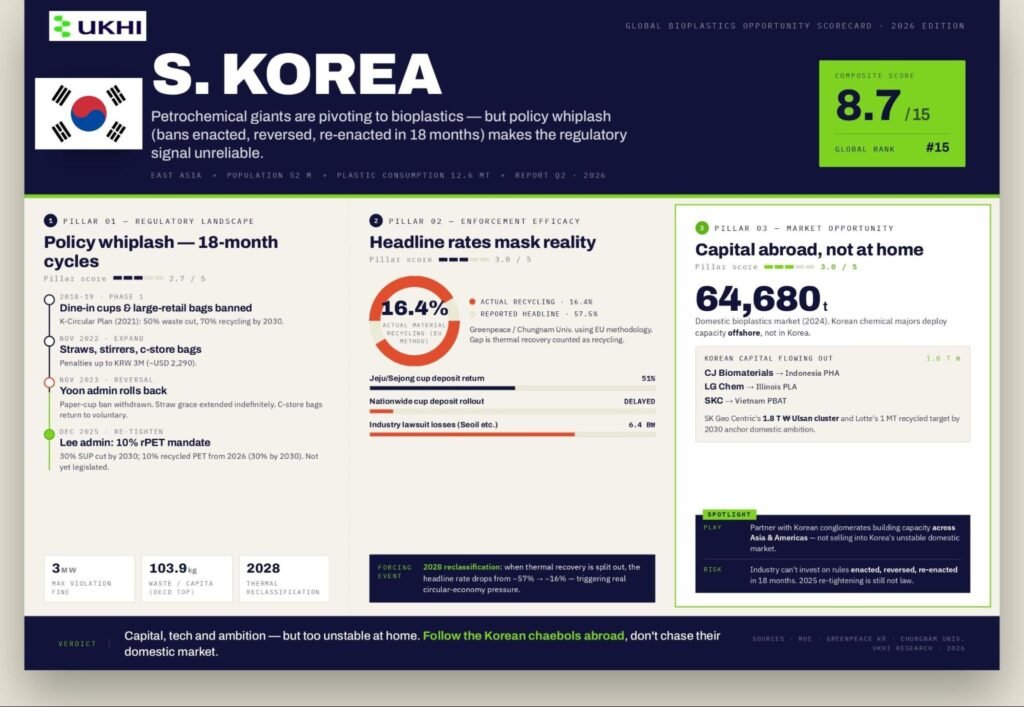
Composite Score: 8.7 / 15 | Global Rank: #15
Petrochemical giants are pivoting to bioplastics but policy whiplash (bans enacted, reversed, re-enacted in 18 months) makes the regulatory signal unreliable.
3.5.1 South Korea’s Single-Use Plastic Ban: Laws and Regulations
3.5.1.1 Key Laws Governing South Korea’s Plastic Ban
- • Primary legislation: Act on Promotion of Saving and Recycling of Resources (1992, amended 2002), plus Framework Act on Resource Circulation (2016) and Carbon Neutrality Act (2021).
- • K-Circular Economy Plan (2021): 50% plastic waste reduction, 70% recycling by 2030.
- • Penalties: Up to KRW 3 million (~USD 2,290) for providing banned SUP items.
3.5.1.2 Which Plastic Items Are Banned in South Korea?
Dine-in plastic cups banned since 2018. Plastic bags in large retailers since January 2019. November 2022: Expanded to straws, stirrers, convenience-store bags.
November 2023 reversal: Yoon administration withdrew paper cup ban, extended straw grace periods indefinitely, and returned convenience-store bags to voluntary.
December 2025 re-tightening: Lee administration announced 30% SUP reduction by 2030, mandatory 10% recycled PET from 2026 (30% by 2030), ban on all straws. Not yet legislated.
3.5.1.3 South Korea’s Plastic Ban Timeline
- • Cup deposit (300-won): Piloted in Jeju/Sejong only. 51% return rate in 2023. Nationwide rollout indefinitely delayed.
- • 2028: MCEE will reclassify thermal recycling separately which means headline recycling rate will drop from ~57% to ~16%.
3.5.2 South Korea’s Plastic Ban Enforcement
- • Policy whiplash is the story. The 2023 reversal left Seoil Corp with 200M+ unsold paper straws. Two firms sued for KRW 6.4 billion in losses. The 2025 re-tightening is not yet law.
- • Recycling is inflated. Official: 57.5%. Greenpeace/Chungnam University using EU methodology: actual material recycling 16.4%.
- • Highest per-capita plastic waste in the OECD — 103.9 kg (MOE), up to 208 kg under broader measurement.
3.5.3 South Korea’s Bioplastics Market Size and Manufacturers
- • Plastic consumption: 12.6 Mt (2022), up 31% since 2019. Bioplastics: ~64,680 tonnes (2024).
- • Key manufacturers — investing offshore: CJ Biomaterials (5,000 TPA PHA in Indonesia, expanding to 65,000). LG Chem (75,000 TPA PLA with ADM in Illinois). SK Geo Centric (KRW 1.8 trillion Ulsan cluster; PBAT JV with Kolon). SKC (70,000 TPA PBAT in Vietnam). Lotte Chemical (1 Mt recycled plastic target by 2030).
3.5.4 Commentary and Insights
- • Policy instability is Korea’s biggest liability. Industry cannot invest on regulations enacted, reversed, and re-enacted within 18 months.
- • 2028 recycling reclassification will be a forcing event. When thermal recovery is separated, the headline rate drops to ~16% which creates political pressure for real circular economy measures.
- • For outside companies, the play is partnership with Korean conglomerates expanding across Asia, not selling into Korea’s unstable domestic market.
3.5.5 South Korea Opportunity Scorecard
| Factor | Score |
| Pillar 1: Regulatory Strength | 2.7 / 5 |
| 1A — Legal Framework Robustness | 3 |
| 1B — Ban Breadth (product categories) | 3 |
| 1C — Future Trajectory | 2 |
| Pillar 2: Enforcement Reality | 3 / 5 |
| Pillar 3: Market Opportunity Gap | 3 / 5 |
| Composite Score | 8.7 / 15 |
Verdict: Korea has capital, technology, and corporate ambition but domestic policy is too unstable to generate reliable demand. Opportunity lies in partnering with Korean conglomerates building capacity across Asia and the Americas, not selling into the domestic market.
3.6 THAILAND – Single-Use Plastic Ban: Market Opportunity Index
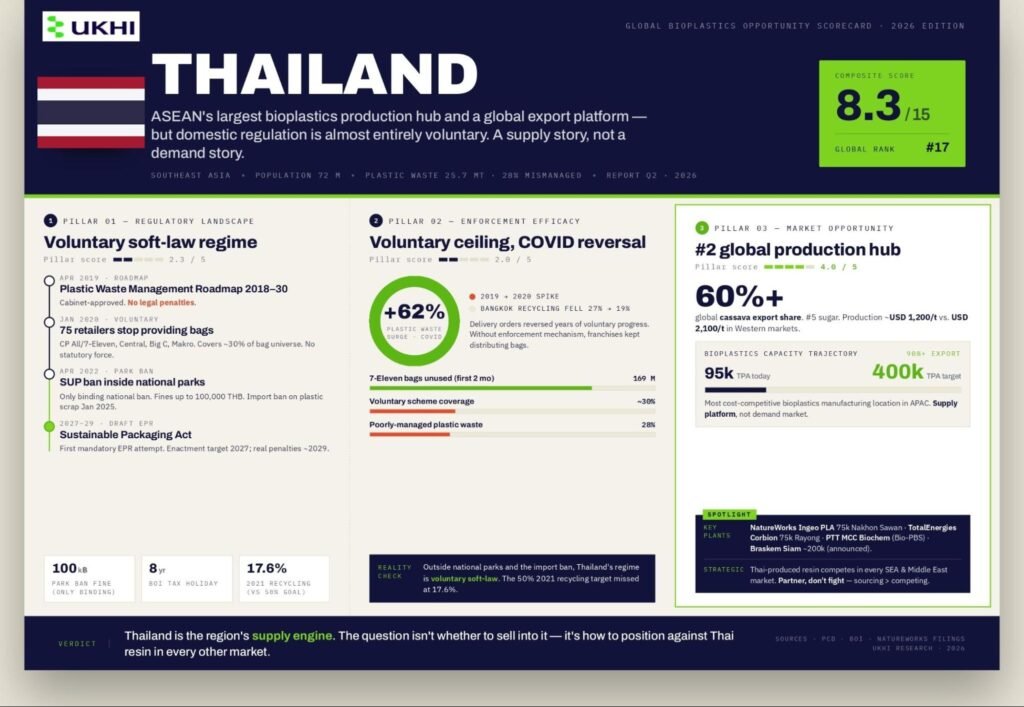
Composite Score: 8.3 / 15 | Global Rank: #17
ASEAN’s largest bioplastics production hub and a global export platform but domestic regulation is almost entirely voluntary. A supply story, not a demand story.
3.6.1 Thailand’s Single-Use Plastic Ban: Laws and Regulations
3.6.1.1 Key Laws Governing Thailand’s Plastic Policy
- • Primary framework: Plastic Waste Management Roadmap 2018–2030 (Cabinet-approved April 2019). No legal penalties.
- • Only binding national ban: National Parks SUP ban (April 2022) with fines up to 100,000 baht (~USD 3,000). Applies inside national parks only.
- • Plastic waste import ban (January 2025): Bans plastic scrap imports, with discretionary exceptions.
- • Draft Sustainable Packaging Management Act (2024): First attempt at mandatory EPR. Targeted enactment 2027, penalties ~2029.
3.6.1.2 Which Plastic Items Are Restricted in Thailand?
- • Voluntary retailer bag ban (January 2020): 75 retailers (CP All/7-Eleven, Central Group, Big C, Makro) stopped providing bags. Covers ~30% of bag universe. No statutory force.
- • Roadmap targets (no penalties): Lightweight bags <36 μm, Styrofoam food containers, cups <100 μm, straws.
- • No nationwide ban on cutlery, plates, stirrers, or packaging. Most permissive regime among the six countries covered.
3.6.1.3 Thailand’s Plastic Reduction Timeline
- • 2027: 100% recyclable plastic (aspirational). Draft EPR Act enactment target.
- • 2029: Earliest date for real EPR penalties.
- • BCG Economy Model: Bioplastics as priority sector — 8-year BOI tax holidays, 1.25× green-tax deductions.
3.6.2 Thailand’s Plastic Ban Enforcement
- • Voluntary ban had a real but limited impact. 7-Eleven reported 169 million bags unused in the first two months. But franchises were documented still distributing bags because of no enforcement mechanism.
- • COVID reversed progress. Plastic waste surged 62% (2019–2020). Bangkok recycling rate fell from 27% to 19%.
- • 2021 recycling rate: 17.6% — missed the roadmap’s 50% target. Outside national parks and the import ban, Thailand’s regime is voluntary soft-law.
3.6.3 Thailand’s Bioplastics Market Size and Manufacturers
- • Plastic consumption: ~75 billion bags/year. Total waste: 25.7 Mt (2022), 28% poorly managed.
- • Bioplastics capacity: #2 global production hubs after the US. ~95,000 TPA, targeting 375,000–400,000 TPA. Over 90% is export-oriented.
- • Key plants: NatureWorks Ingeo PLA (Nakhon Sawan, 75,000 TPA, ~USD 600M). TotalEnergies Corbion PLA (Rayong, 75,000 TPA). PTT MCC Biochem (Bio-PBS). Braskem Siam (announced ~200,000 TPA bio-ethylene).
- • Feedstock advantage: World’s #1 cassava exporter (>60% global share), #5 sugar producers. Production costs ~USD 1,200/tonne vs. USD 2,100 in Western markets.
3.6.4 Commentary and Insights
- • Thailand is a production platform, not a demand market. 90%+ of bioplastics output is exported. Domestic regulation is almost irrelevant to its global supply chain role.
- • Cassava advantage is structural. Largest exporter, lowest cost, BOI incentives — most cost-competitive bioplastics manufacturing location in Asia-Pacific.
- • Voluntary model has a ceiling. Without binding EPR or penalties, domestic SUP reduction will plateau. Draft Packaging Act (2027/2029) is years from having teeth.
3.6.5 Thailand Opportunity Scorecard
| Factor | Score |
| Pillar 1: Regulatory Strength | 2.3 / 5 |
| 1A — Legal Framework Robustness | 2 |
| 1B — Ban Breadth (product categories) | 3 |
| 1C — Future Trajectory | 2 |
| Pillar 2: Enforcement Reality | 2 / 5 |
| Pillar 3: Market Opportunity Gap | 4 / 5 |
| Composite Score | 8.3 / 15 |
Verdict: Thailand’s demand-side score is modest. But Thailand is the region’s bioplastics supply engine: lowest-cost feedstock, largest installed capacity, major global players. The strategic question is not whether to sell into Thailand, but how to position against Thai-produced resin in every other market.
3.7 FRANCE – Single-Use Plastic Ban: Market Opportunity Index
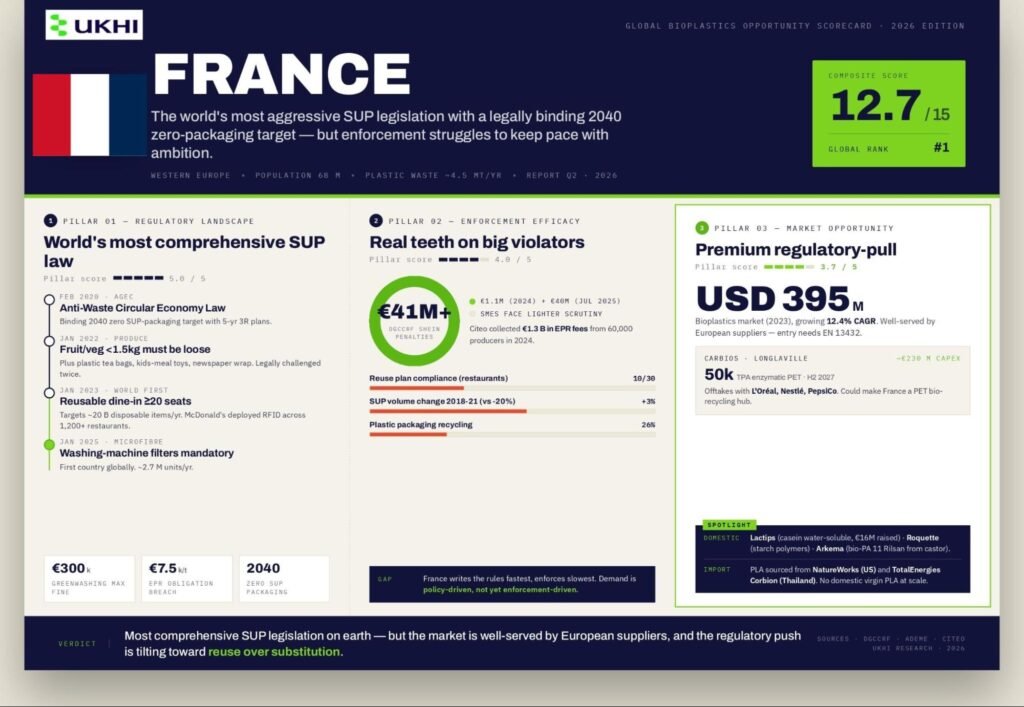
Composite Score: 12.7 / 15 | Global Rank: #1
The world’s most aggressive SUP legislation with a legally binding 2040 zero single-use plastic packaging target, but enforcement struggles to keep pace with ambition.
3.7.1 France’s Single-Use Plastic Ban: Laws and Regulations
3.7.1.1 Key Laws Governing France’s Plastic Ban
- • Primary legislation: The AGEC Law (Loi n° 2020-105) of 10 February 2020 — France’s “Anti-Waste for a Circular Economy” law. Goes far beyond the EU SUP Directive with a legally binding target to eliminate all single-use plastic packaging by 2040.
- • Supporting legislation: The Loi Climat et Résilience (2021) tightened greenwashing rules. SUP Directive transposed via Décret n° 2021-461.
- • Enforcing bodies: Ministry of Ecological Transition (policy), ADEME (producer registrations), DGCCRF (consumer-facing enforcement and penalties).
- • Penalties for non-compliance: EPR non-registration: up to €30,000. EPR obligation breaches: up to €7,500 per tonne. Greenwashing: up to €300,000 or 10% of annual turnover plus two years’ imprisonment. DGCCRF fined Shein €1.098 million in 2024 and €40 million in July 2025.
3.7.1.2 Which Plastic Items Are Banned in France?
- • From January 2020: Plastic cups, plates, straws, cutlery, stirrers, ice-cream tubs, meal trays, salad bowls, confetti.
- • From January 2022: Plastic packaging for fruit and vegetables under 1.5 kg, plastic tea bags, free plastic toys in fast-food kids’ meals, plastic wrap on newspapers. Mandatory compostable produce stickers.
- • From January 2023: France became the first country to mandate reusable containers for dine-in at all restaurants with 20+ seats — targeting ~20 billion disposable items/year. McDonald’s France deployed RFID-tracked reusable containers across 1,200+ restaurants.
- • From January 2025: France is the first country to require microfibre filters on all new washing machines (~2.7 million units/year).
Exemptions: Medical packaging. The fruit-and-veg ban has been legally challenged twice — the Conseil d’État annulled the implementing decree in December 2022 and again in 2023. Currently in legal limbo pending EU PPWR harmonisation.
3.7.1.3 France’s Plastic Ban Timeline and Future Goals
- • 2040 target: Zero single-use plastic packaging — legally binding under AGEC with five-year 3R (reduce-reuse-recycle) action plans.
- • EU PPWR (August 2026): Will harmonise some French rules (fruit/veg packaging, hotel toiletries) at EU level, potentially resolving France’s Conseil d’État impasse.
- • Citeo (France’s packaging EPR body) collected €1.3 billion in EPR contributions in 2024 across 60,000 producers.
3.7.2 France’s Plastic Ban Enforcement: Ground Reality
- • Compliance is uneven. A March 2023 Ministry inspection found 10 of 30 sampled restaurant chains had no reuse compliance plan. McDonald’s publicly said the reuse model “doesn’t work” and France remains the only market requiring it.
- • SUP packaging volumes rose 3% between 2018 and 2021 against a minus-20% AGEC target. Plastic packaging recycling stands at just 26-27% (Citeo 2024), despite household packaging recycling at 69%.
- • Enforcement is real at the top. DGCCRF’s €41M+ in Shein penalties show France will pursue major violators. But small and mid-sized businesses face lighter scrutiny.
3.7.3 France’s Bioplastics Market Size and Manufacturers
- • Plastic waste: ~4.5 Mt/year. Only 23% recycled, 41% incinerated, 36% landfilled.
- • Bioplastics market: Valued at ~USD 395 million (2023), growing at 12.4% CAGR.
- • Key French bioplastics companies: Carbios (enzymatic PET recycling, 50,000 TPA plant at Longlaville with Indorama, ~€230M capex, online H2 2027, offtakes with L’Oréal, Nestlé, PepsiCo). Lactips (casein-based water-soluble bioplastic, €16M raised 2024-25). Roquette (starch-based biopolymers). Arkema (bio-PA 11 Rilsan from castor oil).
Import dependent for PLA — sourced from NatureWorks (USA) and TotalEnergies Corbion (Thailand). :contentReference[oaicite:0]{index=0}
3.7.4 Commentary and Insights
- • France writes the rules fastest but enforces slowest. The gap between AGEC’s ambition and on-ground compliance is the defining tension. For bioplastics suppliers, this means demand is policy-driven but not yet enforcement-driven.
- • The 2023 reusable dine-in mandate is a global first and a test case. If it succeeds in France, expect it to spread via PPWR across the EU. If it fails (McDonald’s is publicly sceptical), it will be a cautionary tale.
- • Carbios is the French bioplastics story to watch. Its enzymatic recycling technology, if it scales at Longlaville by 2027, could make France a PET bio-recycling hub. But this is recycling technology, not virgin bioplastics production.
- • For Ukhi, France is a premium regulatory-pull market. High compliance costs for conventional plastics, strong EPR fees (€1.3B/year), and an aggressive ban calendar create demand, but the market is well-served by European suppliers. Entry requires EN 13432 certification and Citeo registration.
3.7.5 France Opportunity Scorecard
| Factor | Score |
| Pillar 1: Regulatory Strength | 5.0 / 5 |
| 1A — Legal Framework Robustness | 5 |
| 1B — Ban Breadth (product categories) | 5 |
| 1C — Future Trajectory | 5 |
| Pillar 2: Enforcement Reality | 4 / 5 |
| Pillar 3: Market Opportunity Gap | 3.7 / 5 |
| Composite Score | 12.7 / 15 |
Verdict: France has the world’s most comprehensive SUP legislation and the strongest enforcement teeth in Europe. But the market is already well-served by European bioplastics suppliers, and the regulatory push is increasingly toward reuse rather than single-use substitution.
3.8 ITALY – Single-Use Plastic Ban: Market Opportunity Index
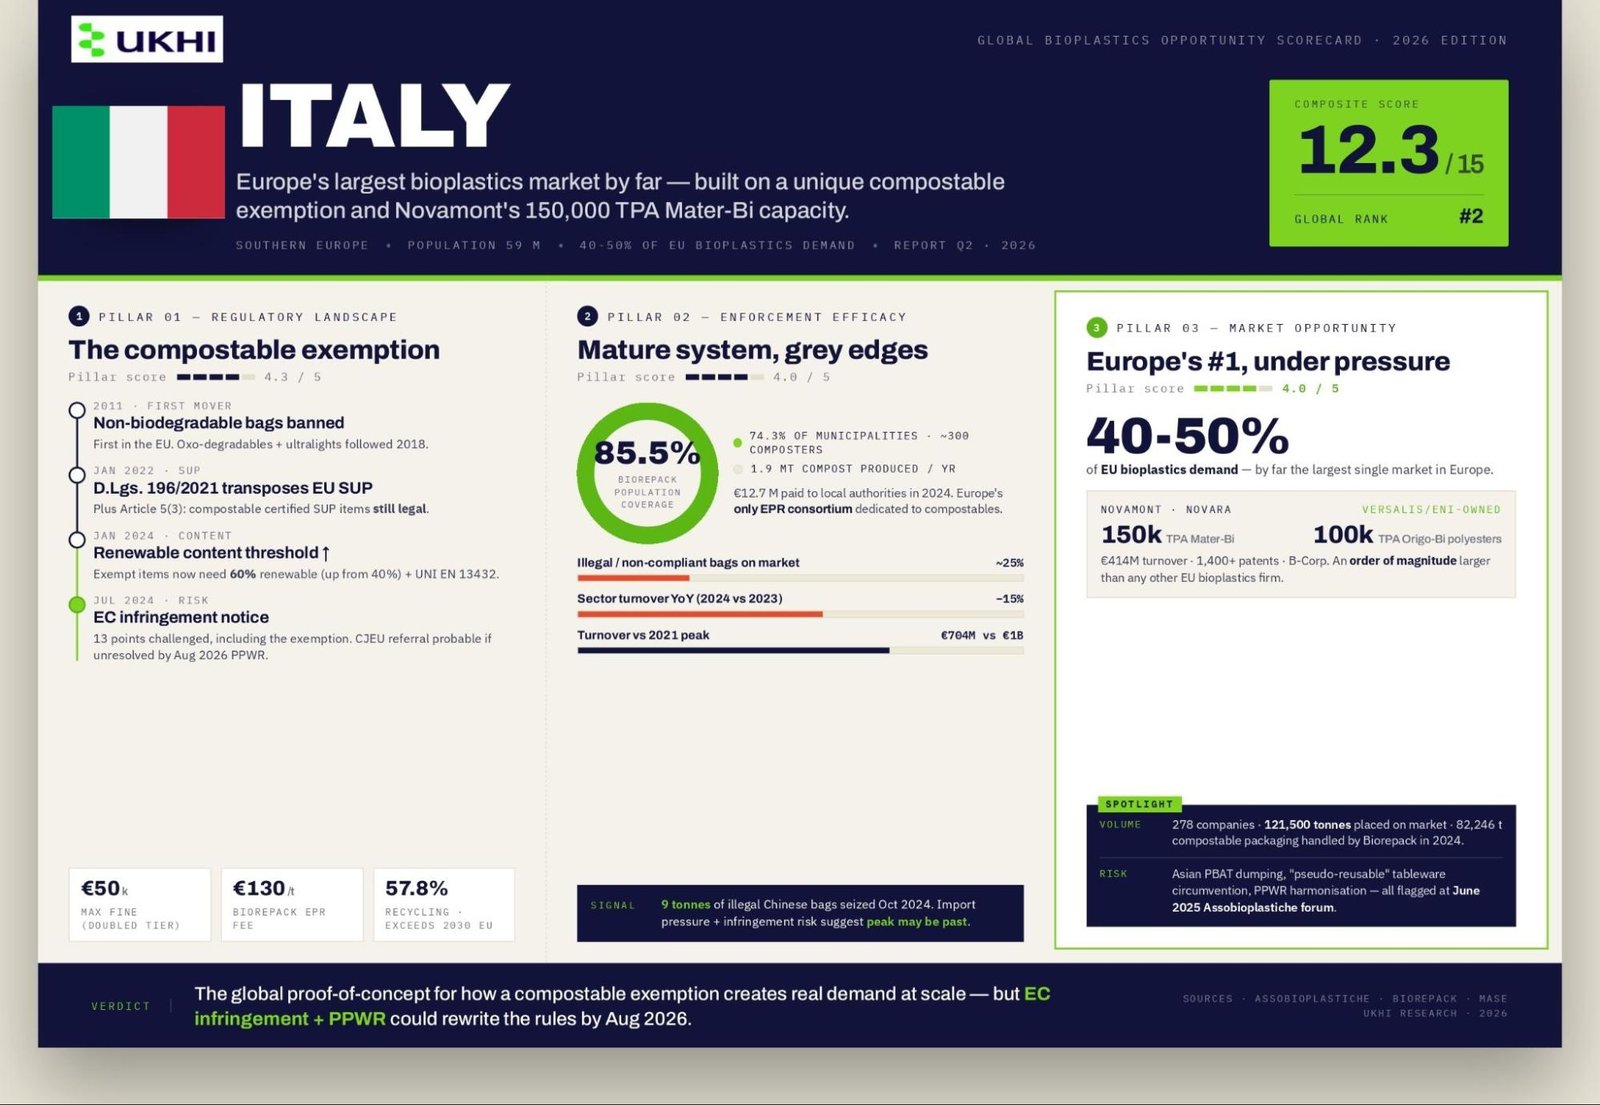
Composite Score: 12.3 / 15 | Global Rank: #2
Europe’s largest bioplastics market by far, and built on a unique compostable exemption and Novamont’s 150,000 TPA Mater-Bi capacity. But the European Commission is now formally challenging the exemption.
3.8.1 Italy’s Single-Use Plastic Ban: Laws and Regulations
3.8.1.1 Key Laws Governing Italy’s Plastic Ban
- • Primary legislation: D.Lgs. 196/2021 (8 November 2021, in force 14 January 2022) transposes the EU SUP Directive.
- • Historical bans predating the directive: Non-biodegradable shopping bags banned since 2011 (the first in the EU). Oxo-degradables and ultralight bags banned 2018. Cosmetic microplastics 2020. Plastic cotton buds 2019.
- • Enforcing bodies: MASE (environment), MIMIT (industry), ISPRA (data).
- • Penalties: €2,500–€25,000 per infraction, doubled to €50,000 where infringing goods exceed 10% of turnover.
3.8.1.2 Italy’s Unique Compostable Plastics Exemption
Article 5(3) of D.Lgs. 196/2021 exempts any SUP product from the ban if it is certified under UNI EN 13432 or UNI EN 14995, contains a minimum 40% renewable raw material (60% from January 2024), and meets at least one additional condition (no reusable alternative, organic collection environment, hygiene requirement, LCA justification).
This exemption makes Italy the only EU country where compostable plastic cutlery, plates, cups, and straws remain legally on sale. It created Europe’s largest bioplastics demand market.
The European Commission issued a formal infringement notice in July 2024 covering 13 points of D.Lgs. 196/2021, including the compostable exemption. A CJEU referral is probable if Italy does not amend.
3.8.1.3 Italy’s Plastic Ban Timeline and Future Goals
- • EU PPWR (August 2026): Will override many Italian national rules. Italy has sought PPWR exemptions for compostable packaging but outcome is uncertain.
- • Biorepack targets: Italy’s dedicated compostable packaging EPR consortium already exceeds both the 2025 EU 50% and 2030 EU 55% recycling targets, achieving 57.8% recycling in 2024 across 82,246 tonnes placed on market.
3.8.2 Italy’s Plastic Ban Enforcement: Ground Reality
- • The compostable exemption works — but creates a grey market. Assobioplastiche estimates ~25% of bags on the Italian market are illegal or non-compliant. Customs seized 9 tonnes of illegally imported Chinese plastic bags in October 2024.
- • Biorepack’s collection system is mature. Covers 85.5% of the Italian population, 74.3% of municipalities, with ~300 composting facilities producing 1.9 Mt compost/year. €12.7 million paid to local authorities in 2024.
- • Sector just contracted. 2024 turnover: €704 million, down 15% from 2023’s €828 million peak across 278 companies and 121,500 tonnes. Peak was €1 billion in 2021.
3.8.3 Italy’s Bioplastics Market Size and Manufacturers
- • Market position: Italy takes an estimated 40-50% of EU bioplastics demand by far the largest single market.
- • Novamont (Novara, fully owned by Versalis/Eni since 2023): 150,000 TPA Mater-Bi capacity, 100,000 TPA Origo-Bi biopolyesters. Bio-BDO production at Bottrighe di Adria. €414M turnover (2021), 1,400+ patents, B Corp certified.
- • Biorepack: Europe’s only EPR consortium for compostable packaging. Environmental contribution: €130/tonne (2024).
- • Import pressure: Cheap Asian PBAT and starch blends are undercutting domestic producers. Assobioplastiche flagged “pseudo-reusable” tableware circumvention and dumping at June 2025 forum.
Source: :contentReference[oaicite:0]{index=0}
3.8.4 Commentary and Insights
- • Italy’s compostable exemption is the single most important policy for bioplastics demand in Europe. It created a market where compostable alternatives replaced banned plastics at scale. No other EU country replicated this.
- • The Commission’s July 2024 infringement notice is the biggest risk. If Italy is forced to remove the exemption, demand for compostable SUP items could collapse overnight. PPWR’s August 2026 application date is the likely deadline for resolution.
- • Novamont/Versalis is the industrial backbone. At 150,000 TPA Mater-Bi plus 100,000 TPA biopolyesters, Novamont’s capacity is an order of magnitude larger than any other European bioplastics producer. Italy’s bioplastics story is largely a Novamont story.
- • The 15% revenue contraction in 2024 signals the market is either maturing or shrinking. Import competition, legal uncertainty around the exemption, and AGCM enforcement actions against Novamont itself suggest the peak may have passed.
3.8.5 Italy Opportunity Scorecard
| Factor | Score |
| Pillar 1: Regulatory Strength | 4.3 / 5 |
| 1A — Legal Framework Robustness | 4 |
| 1B — Ban Breadth (product categories) | 5 |
| 1C — Future Trajectory | 4 |
| Pillar 2: Enforcement Reality | 4 / 5 |
| Pillar 3: Market Opportunity Gap | 4 / 5 |
| Composite Score | 12.3 / 15 |
Verdict: Italy is Europe’s largest bioplastics market and the global proof-of-concept for how a compostable exemption can create real demand at scale. But the Commission’s infringement action and PPWR harmonisation create material risk. The 15% revenue decline in 2024, combined with import pressure from Asian producers, suggests the window of easy growth is closing. For an exporter, Italy remains the single best European market but one that requires careful positioning against both Novamont’s dominance and regulatory uncertainty.
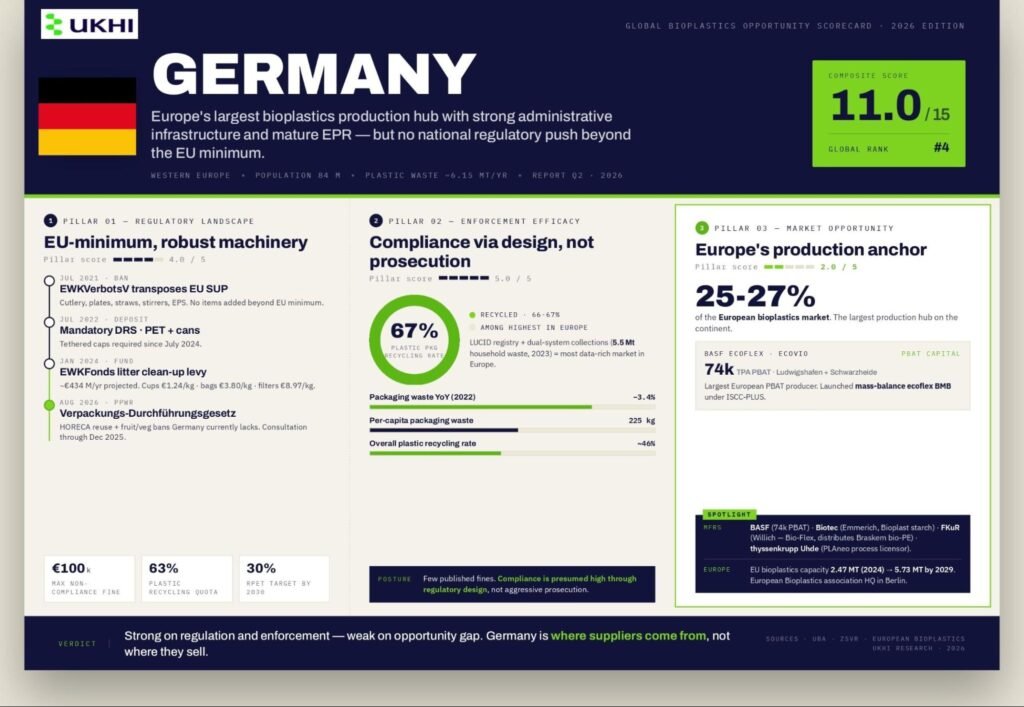
3.9 GERMANY – Single-Use Plastic Ban: Market Opportunity Index
Composite Score: 11.0 / 15 | Global Rank: #4
Europe’s largest bioplastics production hub with strong administrative infrastructure and mature EPR, but no national regulatory push beyond the EU minimum.
3.9.1 Germany’s Single-Use Plastic Ban: Laws and Regulations
3.9.1.1 Key Laws Governing Germany’s Plastic Ban
- • SUP ban: The Einwegkunststoffverbotsverordnung (EWKVerbotsV) (in force 3 July 2021) transposes the EU SUP Directive’s Article 5 product bans. Einwegkunststoffkennzeichnungsverordnung (EWKKennzV) covers labelling.
- • Litter clean-up fund: The Einwegkunststofffondsgesetz (EWKFondsG) (effective 1 January 2024) created a fund administered by the Umweltbundesamt (UBA) via the DIVID platform. Projected at ~€434 million/year.
- • Packaging EPR: The Verpackungsgesetz (VerpackG) requires all packaging producers to register in the LUCID registry at the Zentrale Stelle Verpackungsregister (ZSVR). Plastic packaging recycling quota: 63%.
- • Penalties: Up to €100,000 for non-compliance.
Fund levy rates (per kg): Beverage cups €1.236, lightweight carrier bags €3.801, balloons €4.340, tobacco filters €8.972.
3.9.1.2 Which Plastic Items Are Banned in Germany?
- • Standard EU SUP Directive list: Cotton bud sticks, cutlery, plates, straws, stirrers, balloon sticks, expanded polystyrene food containers and cups, all oxo-degradable plastics.
- • Germany has not banned any additional items beyond the EU minimum. No fruit-and-veg packaging ban. No reusable dine-in mandate.
- • Mandatory deposit return on PET bottles and cans since July 2022. Tethered caps required since July 2024.
3.9.1.3 Germany’s Plastic Ban Timeline and Future Goals
- • EU PPWR (August 2026): Germany is preparing a Verpackungs-Durchführungsgesetz to implement PPWR, in consultation through December 2025. PPWR will bring HORECA reuse mandates and fruit/veg packaging bans that Germany does not currently have.
- • 2025: First EWKFonds levy payments due. 25% recycled content in PET bottles.
- • 2030: 30% recycled content in all SUP plastic bottles (EU target). PPWR recyclability requirements.
3.9.2 Germany’s Plastic Ban Enforcement: Ground Reality
- • Strong administrative infrastructure. The LUCID registry, dual-system collections (5.5 Mt from households in 2023), and established EPR machinery make Germany the most data-rich market in Europe.
- • Packaging waste: 19.0 Mt in 2022 (225 kg per capita, down 3.4% YoY). Plastic packaging recycling rate: 66-67%, which is among the highest in Europe.
- • Few published fines. Compliance is presumed high through regulatory design rather than aggressive prosecution.
3.9.3 Germany’s Bioplastics Market Size and Manufacturers
- • Plastic waste: ~6.15 Mt/year, ~46% recycling rate overall.
- • Bioplastics market share: Germany holds ~25-27% of the European bioplastics market (Mordor Intelligence) and is the largest production hub in Europe.
- • Key German bioplastics manufacturers: BASF (ecoflex PBAT and ecovio compounds at Ludwigshafen and Schwarzheide, ~74,000 TPA PBAT capacity; launched mass-balance “ecoflex BMB” under ISCC-PLUS), Biotec GmbH (Emmerich, starch-based compounds), FKuR (Willich — Bio-Flex, Biograde, Fibrolon, Terralene; distributes Braskem bio-PE). thyssenkrupp Uhde licenses the PLAneo PLA process.
European Bioplastics (Berlin) reports capacity growth from 2.47 Mt (2024) to 5.73 Mt by 2029. :contentReference[oaicite:0]{index=0}
3.9.4 Commentary and Insights
- • Germany is a production hub, not a demand-pull market. Its regulatory framework matches the EU minimum. Bioplastics demand in Germany is driven by brand-owner sustainability commitments and EU-wide regulation, not by German policy.
- • BASF’s ecoflex/ecovio makes Germany the PBAT capital of Europe. At ~74,000 TPA, BASF is the largest European PBAT producer. Combined with FKuR and Biotec, Germany’s position as production anchor is durable.
- • PPWR will be the forcing event. From August 2026, Germany will face reuse mandates and packaging bans it currently lacks. Adjustment should be smoother than in Southern or Eastern Europe due to existing infrastructure.
3.9.5 Germany Opportunity Scorecard
| Factor | Score |
| Pillar 1: Regulatory Strength | 4.0 / 5 |
| 1A — Legal Framework Robustness | 4 |
| 1B — Ban Breadth (product categories) | 3 |
| 1C — Future Trajectory | 5 |
| Pillar 2: Enforcement Reality | 5 / 5 |
| Pillar 3: Market Opportunity Gap | 2 / 5 |
| Composite Score | 11.0 / 15 |
Verdict: Germany’s score is strong on regulation and enforcement but weak on opportunity gap. The market is already well-served by Europe’s largest bioplastics producers. PPWR will tighten requirements from 2026, but German industry is best-positioned to absorb those changes. For outside entrants, this is a mature, competitive market.
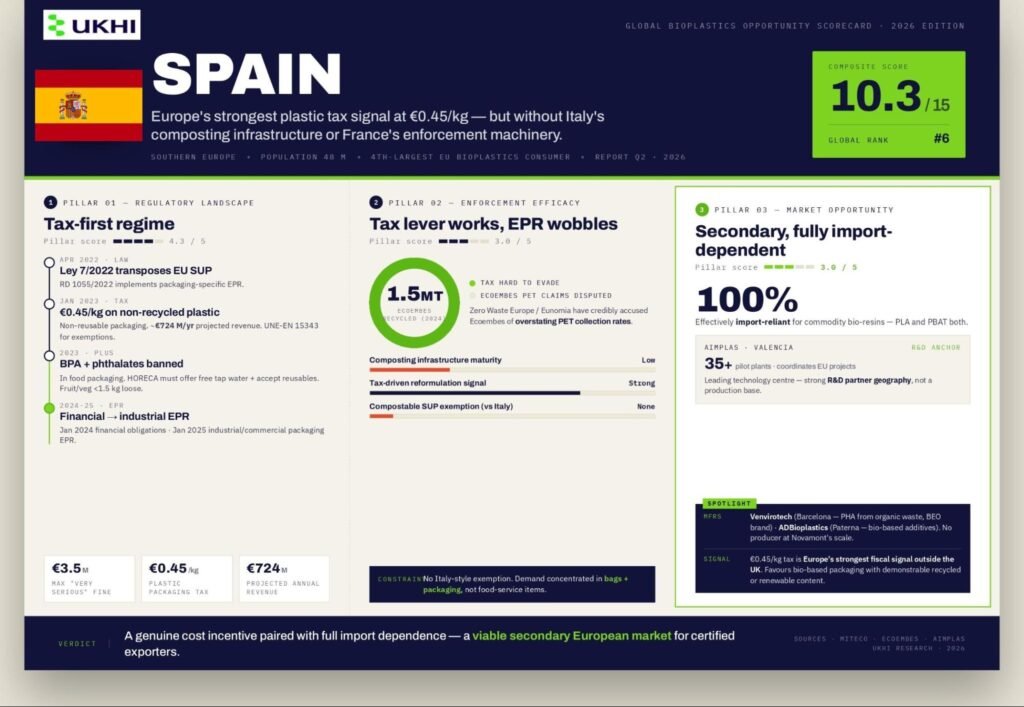
3.10 SPAIN – Single-Use Plastic Ban: Market Opportunity Index
Composite Score: 10.3 / 15 | Global Rank: #6
Europe’s strongest plastic tax signal at €0.45/kg but without Italy’s composting infrastructure or France’s enforcement machinery.
3.10.1 Spain’s Single-Use Plastic Ban: Laws and Regulations
3.10.1.1 Key Laws Governing Spain’s Plastic Ban
- • Primary legislation: Ley 7/2022 (8 April 2022) transposes the SUP Directive. Real Decreto 1055/2022 implements packaging-specific EPR.
- • Lead ministry: MITECO. Fines: very serious infractions €100,001–€3.5 million, serious €2,001–€100,000.
- • Plastic packaging tax: €0.45/kg on non-recycled plastic in non-reusable packaging since January 2023. Projected revenue: ~€724 million/year. Recycled content exemptions require UNE-EN 15343 certification.
3.10.1.2 Which Plastic Items Are Banned in Spain?
- • EU SUP Directive standard list plus: BPA and phthalates banned in food packaging. HORECA must offer free tap water and accept reusable containers. Fresh fruit and vegetables under 1.5 kg must be sold loose.
- • No compostable exemption like Italy.
- • No reusable dine-in mandate like France.
3.10.1.3 Spain’s Plastic Ban Timeline
- • January 2024: Financial EPR obligations in force.
- • January 2025: Industrial/commercial packaging EPR.
- • EU PPWR (August 2026): Will layer additional HORECA reuse mandates and recycled content requirements.
3.10.2 Spain’s Plastic Ban Enforcement
- • Ecoembes runs household packaging EPR (1.5 Mt recycled in 2024). But Zero Waste Europe/Eunomia have credibly accused Ecoembes of overstating PET collection rates.
- • The €0.45/kg tax is the real enforcement lever — harder to evade than product bans. It creates a direct cost incentive to switch to recycled or bio-based materials.
- • Composting infrastructure is limited. Without Italian-scale organic waste collection, compostable bioplastics have constrained end-of-life options.
3.10.3 Spain’s Bioplastics Market Size and Manufacturers
- • Position: Fourth-largest European bioplastics consumer. No producer at Novamont’s scale.
- • Key players: AIMPLAS (Valencia — leading technology centre, 35+ pilot plants, coordinates EU projects). Venvirotech (Barcelona — PHA from organic waste via bacterial fermentation, BEO brand). ADBioplastics (Paterna — bio-based additives).
- • Import dependent for PLA and PBAT. Effectively 100% reliant on imports for commodity bio-resins.
3.10.4 Commentary and Insights
- • The €0.45/kg tax is Europe’s strongest fiscal signal outside the UK. It makes Spain attractive for bio-based packaging suppliers who can demonstrate recycled or renewable content.
- • No Italian-style compostable exemption limits the addressable market. Without an exemption allowing compostable cutlery and plates, demand is concentrated in bags and packaging rather than food service items.
- • AIMPLAS makes Spain a strong R&D partner geography but not a production base.
3.10.5 Spain Opportunity Scorecard
| Factor | Score |
| Pillar 1: Regulatory Strength | 4.3 / 5 |
| 1A — Legal Framework Robustness | 5 |
| 1B — Ban Breadth (product categories) | 4 |
| 1C — Future Trajectory | 4 |
| Pillar 2: Enforcement Reality | 3 / 5 |
| Pillar 3: Market Opportunity Gap | 3 / 5 |
| Composite Score | 10.3 / 15 |
Verdict: Spain’s plastic tax creates a genuine cost incentive for bioplastics, but the market lacks Italy’s compostable exemption and France’s enforcement apparatus. A strong R&D ecosystem (AIMPLAS) and full import dependence make it a viable secondary European market.
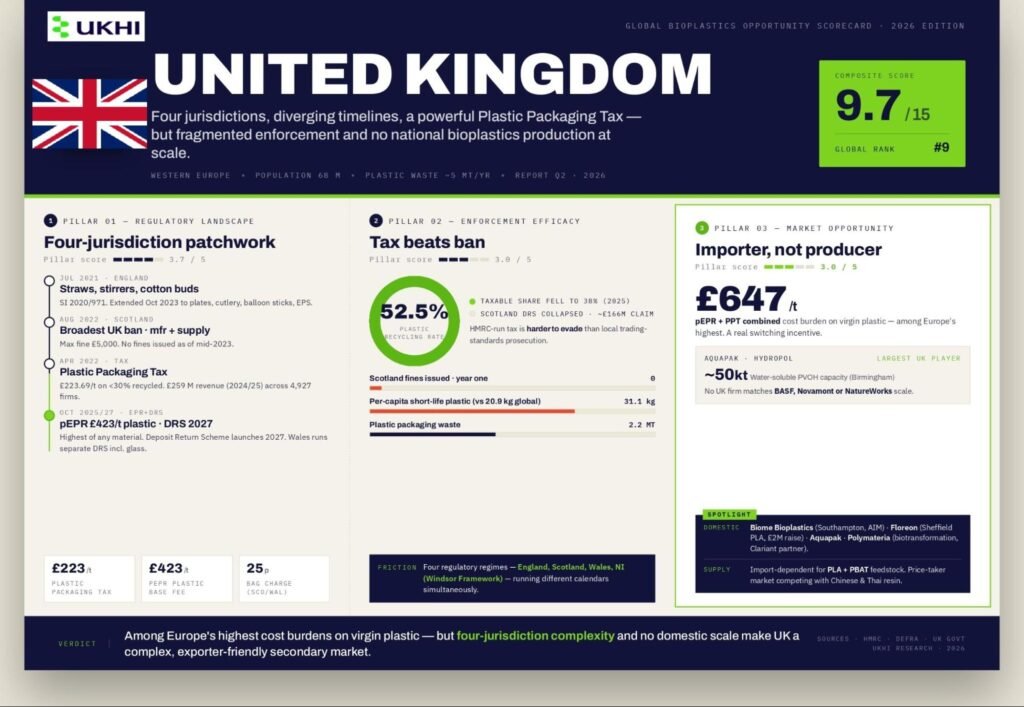
3.11 UNITED KINGDOM – Single-Use Plastic Ban: Market Opportunity Index
Composite Score: 9.7 / 15 | Global Rank: #9
Four separate jurisdictions, diverging ban timelines, and a powerful Plastic Packaging Tax — but fragmented enforcement and no national bioplastics production at scale.
3.11.1 UK’s Single-Use Plastic Ban: Laws and Regulations
3.11.1.1 Key Laws Governing the UK’s Plastic Ban
- • England: SI 2020/971 banned plastic straws, cotton buds, and stirrers (effective July 2021). SI 2023/982 (October 2023) added plates, cutlery, balloon sticks, and polystyrene food/drink containers.
- • Scotland: SSI 2021/373 is the broadest UK ban, covering manufacture and supply. In force August 2022. Maximum fine: £5,000. No fines issued as of mid-2023.
- • Wales: Single-use Plastic Products (Wales) Act 2023 — Phase 1 from October 2023, unlimited fines. Phase 2 (bags, polystyrene lids, oxo-degradables) delayed indefinitely per February 2026 Written Statement. Wet wipes ban: December 2026.
- • Northern Ireland: Bound to EU SUP via Windsor Framework but never formally transposed item bans. Wet wipes ban: May 2027.
3.11.1.2 Which Plastic Items Are Banned in the UK?
- • Across England, Scotland, Wales: Straws, stirrers, cotton buds (2020/21). Plates, cutlery, balloon sticks, polystyrene food containers (2023). Scotland also bans polystyrene cup lids.
- • Not banned: Plastic bags (subject to mandatory 10p charge in England since 2015, currently at 25p in Scotland and Wales). No ban on plastic packaging for fruit/veg. No reusable dine-in mandate.
- • Plastic Packaging Tax (UK-wide): £223.69/tonne (2025/26) on packaging with <30% recycled content. Revenue: £259 million (2024/25). 4,927 registered businesses.
3.11.1.3 UK’s Plastic Ban Timeline and Future Goals
- • October 2025: First pEPR (Extended Producer Responsibility) invoices. Plastic base fee: £423/tonne, which is highest of any material.
- • October 2027: Deposit Return Scheme across England, Scotland, Northern Ireland (PET, steel, aluminium). Wales runs a separate DRS including glass.
- • No 2040 zero-plastic target like France. UK’s trajectory depends on pEPR fee escalation and PPWR alignment for exports to EU.
3.11.2 UK’s Plastic Ban Enforcement: Ground Reality
- • Enforcement is light across all four jurisdictions. Scotland issued no fines in year one of its ban. English local authority enforcement data is minimal.
- • Scotland’s DRS collapsed. The planned August 2023 launch was abandoned. Circularity Scotland went into administration. Biffa is pursuing a ~£166 million compensation claim from the Scottish Government.
- • The Plastic Packaging Tax is the real enforcement lever. HMRC-administered, tax-based, and far harder to evade than a local trading standards prosecution. The taxable share fell to 38% in 2025, suggesting it’s driving reformulation toward recycled content.
3.11.3 UK’s Bioplastics Market Size and Manufacturers
- • Plastic waste: ~5 Mt/year total, 2.1–2.2 Mt plastic packaging waste. Recycling rate: 52.5%. Per-capita short-life plastic: 31.1 kg/year (vs. 20.9 kg global average).
- • UK bioplastics producers (scale-limited): Biome Bioplastics (Southampton), Floreon (Sheffield, PLA-based materials), Aquapak Polymers (Hydropol PVOH, ~50 kt capacity), Polymateria (London, biotransformation tech).
- • Import dependent for PLA and PBAT feedstocks. No large-scale bio-resin production.
Source: :contentReference[oaicite:0]{index=0}
3.11.4 Commentary and Insights
- • The £423/tonne pEPR fee is the UK’s most powerful bioplastics incentive. Combined with the Plastic Packaging Tax, the regulatory cost burden on virgin plastic is among Europe’s highest.
- • Four-jurisdiction fragmentation is a major market barrier. Different bans, DRS timelines, UKIMA complications, and Windsor Framework complexity create regulatory friction.
- • The UK is an importer, not a producer. This creates a supply gap but also makes the market highly price-sensitive and exposed to global resin pricing.
3.11.5 UK Opportunity Scorecard
| Factor | Score |
| Pillar 1: Regulatory Strength | 3.7 / 5 |
| 1A — Legal Framework Robustness | 4 |
| 1B — Ban Breadth (product categories) | 3 |
| 1C — Future Trajectory | 4 |
| Pillar 2: Enforcement Reality | 3 / 5 |
| Pillar 3: Market Opportunity Gap | 3 / 5 |
| Composite Score | 9.7 / 15 |
Verdict: The UK’s regulatory cost burden on conventional plastics (pEPR + Plastic Packaging Tax) is among Europe’s highest, creating genuine demand pull for alternatives. But four-jurisdiction fragmentation, weak enforcement, and lack of domestic production make it a complex, compliance-heavy market best suited for experienced exporters.
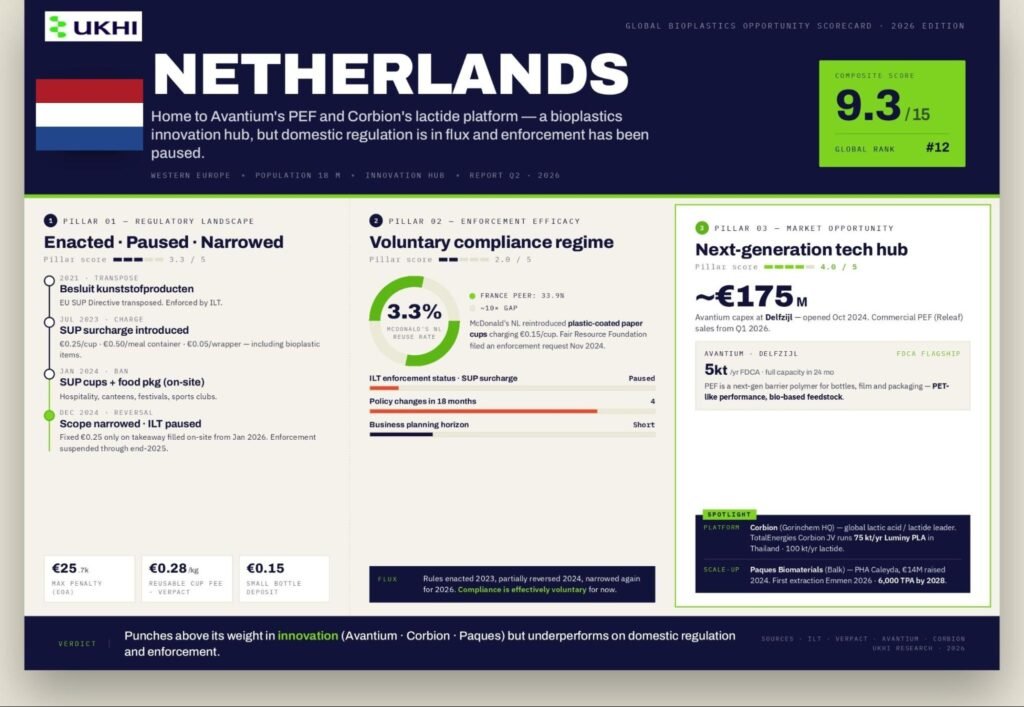
3.12 NETHERLANDS – Single-Use Plastic Ban: Market Opportunity Index
Composite Score: 9.3 / 15 | Global Rank: #12
Home to Avantium’s PEF and Corbion’s lactide platform; a bioplastics innovation hub, but domestic regulation is in flux and enforcement has been paused.
3.12.1 Netherlands’ Single-Use Plastic Ban: Laws and Regulations
- • Primary legislation: Besluit kunststofproducten voor eenmalig gebruik (Staatsblad 2021, 294) transposes the SUP Directive. Enforced by ILT (Human Environment and Transport Inspectorate).
- • SUP charge (July 2023): Guideline tariffs of €0.25/cup, €0.50/meal container, €0.05/small wrapper, including bioplastic items.
- • January 2024 ban: SUP cups and food packaging for on-site consumption in hospitality, canteens, festivals, sports clubs.
- • December 2024 reversal: Government narrowed scope and fixed €0.25 surcharge only on takeaway filled on-site from January 2026, exempting supermarkets and delivery.
- • Enforcement paused: State Secretary Aartsen instructed ILT not to enforce SUP surcharge rules through 31 December 2025.
- • Penalties: Up to ~€25,750 under the Economic Offences Act.
3.12.2 Netherlands’ Plastic Ban Enforcement
- • Enforcement is effectively suspended. The ILT non-enforcement instruction through end-2025 means compliance is voluntary for now.
- • McDonald’s Netherlands reportedly reintroduced plastic-coated paper cups for on-site service while charging €0.15/cup, to which the Fair Resource Foundation filed an enforcement request in November 2024. France’s McDonald’s reuse rate: 33.9% vs. Netherlands: 3.3%.
- • Policy is unstable. Rules enacted in 2023, partially reversed in 2024, narrowed again for 2026. Businesses face uncertainty.
3.12.3 Netherlands’ Bioplastics Market and Innovation
- • EPR body: Verpact (formerly Afvalfonds Verpakkingen). Reusable plastic cup fee: €0.28/kg. Small bottle deposit: €0.15.
- • Avantium (Amsterdam-listed): Opened 5 kt/year FDCA Flagship Plant at Delfzijl in October 2024. ~€175M capex. Commercial PEF sales (Releaf brand) expected Q1 2026. Full capacity within 24 months.
- • Corbion (Gorinchem HQ): Global lactic acid and lactide leader. TotalEnergies Corbion JV operates 75 kt/year Luminy PLA plant in Thailand, with lactide capacity at 100 kt/year.
- • Paques Biomaterials (Balk): Scaling PHA under Caleyda brand. €14M raised 2024. First commercial extraction Emmen 2026. Full-scale 6,000 TPA by 2028.
3.12.4 Commentary and Insights
- • Netherlands is an innovation hub, not a demand market. Avantium’s PEF, Corbion’s lactide, and Paques’ PHA represent next-generation bioplastics technology, but domestic consumption is modest.
- • Policy instability undermines the market signal. Businesses cannot plan when rules are enacted, paused, reversed, and narrowed within 18 months. Until enforcement resumes, the SUP regime is effectively voluntary.
3.12.5 Netherlands Opportunity Scorecard
| Factor | Score |
| Pillar 1: Regulatory Strength | 3.3 / 5 |
| 1A — Legal Framework Robustness | 3 |
| 1B — Ban Breadth (product categories) | 3 |
| 1C — Future Trajectory | 4 |
| Pillar 2: Enforcement Reality | 2 / 5 |
| Pillar 3: Market Opportunity Gap | 4 / 5 |
| Composite Score | 9.3 / 15 |
Verdict: The Netherlands punches far above its weight in bioplastics innovation (Avantium, Corbion, Paques) but underperforms on domestic regulation and enforcement.
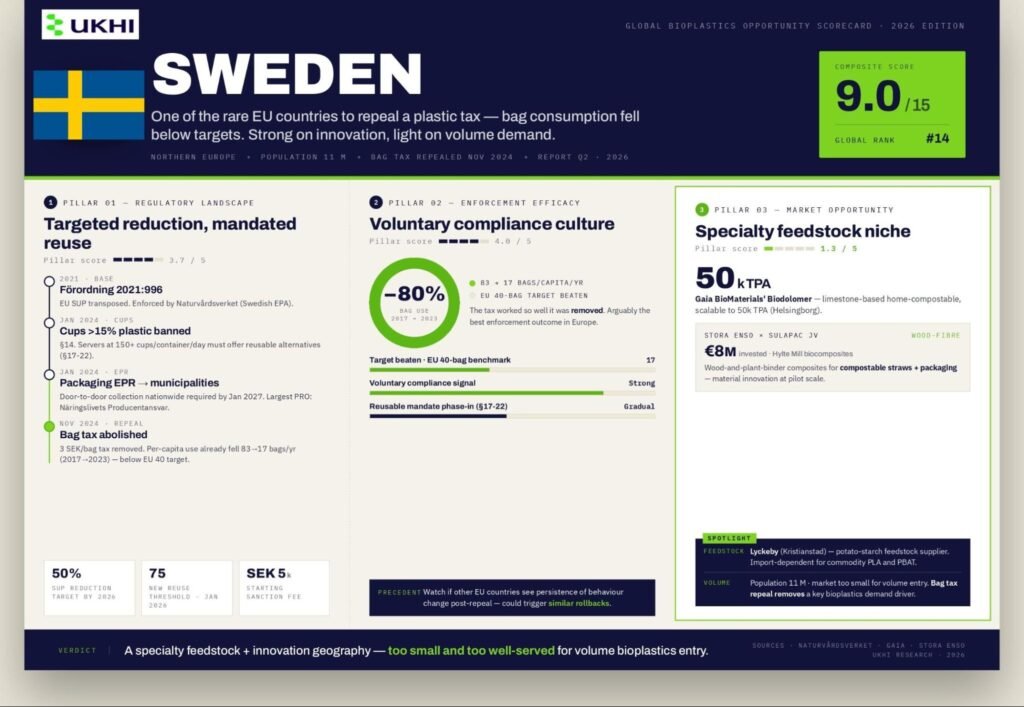
3.13 SWEDEN – Single-Use Plastic Ban: Market Opportunity Index
Composite Score: 9.0 / 15 | Global Rank: #14
One of the rare EU countries to repeal a plastic tax — bag consumption already fell below targets. Strong on innovation, light on volume demand.
4. Compostable Plastics for Injection Moulding – Demand Drivers and Regulatory Landscape
Demand for compostable formats in injection-moulded categories is coming from two directions: brand owners responding to regulatory pressure, and a smaller but growing body of consumers willing to pay a premium for certified sustainable packaging. Of the two, regulation is the more reliable and durable signal.
3.13.1 Sweden’s Single-Use Plastic Ban: Laws and Regulations
- • Primary legislation: Förordning (2021:996) transposes the SUP Directive. Enforced by the Swedish EPA (Naturvårdsverket).
- • Section 14: Banned single-use cups with >15% plastic from January 2024.
- • Sections 17–22: Food/drink servers providing >150 cups/containers per open day must offer reusable alternatives (threshold drops to 75 from January 2026).
- • Section 24–25: 50% reduction target for SUP cups and food containers by 2026.
- • Penalties: Environmental sanction fees from SEK 5,000 for ≤100 products, scaling upward.
- • Sweden’s plastic bag tax (3 SEK/bag, introduced May 2020) was abolished 1 November 2024. Per-capita consumption had already fallen from 83 bags (2017) to 17 (2023), well below the EU 40-bag target.
- • Shifted to municipalities on 1 January 2024. Nationwide door-to-door collection required by January 2027. Largest PRO: Näringslivets Producentansvar (formerly FTI).
3.13.2 Sweden’s Plastic Ban Enforcement
- • Compliance culture is strong. Swedish businesses generally comply voluntarily with environmental regulation.
- • The bag tax worked so well it was removed. An 80% reduction in bag use within three years made the tax redundant. This is arguably the best enforcement outcome in Europe.
- • Reusable alternatives mandate (Sections 17–22) is being phased in gradually.
3.13.3 Sweden’s Bioplastics Market and Manufacturers
- • Production is modest but technically distinctive.
- • Gaia BioMaterials (Helsingborg — Biodolomer limestone-based home-compostable bioplastic, scalable to 50,000 TPA).
- • Stora Enso / Sulapac JV (wood-and-plant-binder biocomposites, compostable straws, €8M invested at Hylte Mill).
- • Lyckeby (Kristianstad — potato-starch feedstock).
- • Import dependent for PLA and PBAT.
3.13.4 Commentary and Insights
- • Sweden is a specialty feedstock and innovation geography. Biodolomer’s limestone approach and Stora Enso’s wood-fibre composites represent genuine material innovation, but at pilot scale.
- • The bag tax repeal is a signal worth watching. If other EU countries see that behaviour change persists after tax removal, it could trigger similar rollbacks.
3.13.5 Sweden Opportunity Scorecard
| Factor | Score |
| Pillar 1: Regulatory Strength | 3.7 / 5 |
| 1A — Legal Framework Robustness | 4 |
| 1B — Ban Breadth (product categories) | 3 |
| 1C — Future Trajectory | 4 |
| Pillar 2: Enforcement Reality | 4 / 5 |
| Pillar 3: Market Opportunity Gap | 1.3 / 5 |
| Composite Score | 9.0 / 15 |
Verdict: Sweden’s market is too small and well-served for volume bioplastics entry. The bag tax repeal is a success story but removes a bioplastics demand driver.
3.14 DENMARK – Single-Use Plastic Ban: Market Opportunity Index
Composite Score: 8.7 / 15 | Global Rank: #16
The EU’s last country to launch packaging EPR; strong on enzymes and biotech R&D, but structurally import-dependent for bioplastics.
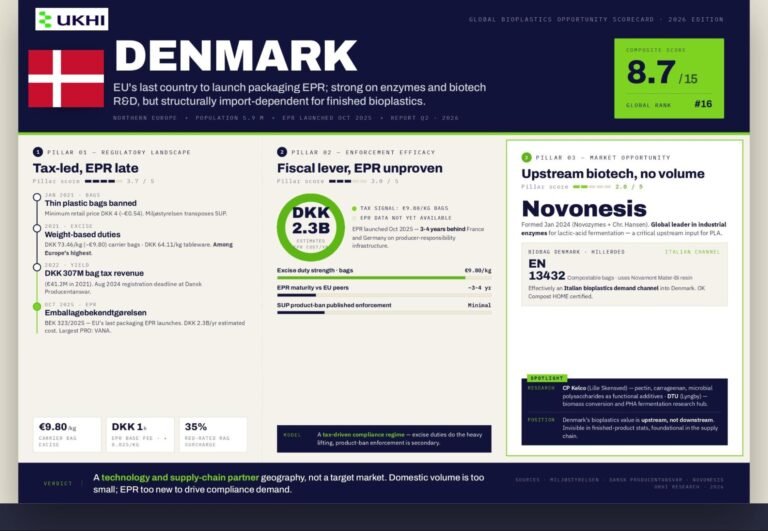
3.14.1 Denmark’s Single-Use Plastic Ban: Laws and Regulations
- • Primary legislation: Bekendtgørelse om visse engangsplastprodukter under the Danish EPA (Miljøstyrelsen) transposes the SUP Directive.
- • Thin plastic bags: Banned from January 2021. Minimum retail price: DKK 4 (~€0.54) per bag.
- • Weight-based excise duties: Carrier bags DKK 73.46/kg (~€9.80/kg). Disposable tableware DKK 64.11/kg (~€8.60/kg). Total bag tax revenue: DKK 307 million (€41.2M) in 2021.
- • Denmark was the last EU country to launch packaging EPR. The Emballagebekendtgørelsen (BEK 323/2025) took effect 1 October 2025 after delays from January and July 2025.
- • Registration at Dansk Producentansvar was due August 2024. Fees include annual DKK 1,000 base plus DKK 0.025/kg supervisory fee and RAG eco-modulation (35% red-rated surcharge).
- • Estimated net EPR cost: DKK 2.3 billion/year. Largest PRO: VANA.
3.14.2 Denmark’s Plastic Ban Enforcement
- • Excise duties are the primary mechanism. At €9.80/kg for carrier bags (among the highest in Europe) the fiscal signal is clear. This is a tax-driven compliance model.
- • EPR is too new to assess. With the system launching only in October 2025, compliance data, enforcement actions, and recycling outcomes are not yet available.
- • Standard EU SUP product bans (cutlery, straws, plates, stirrers, etc.) are in force. No published enforcement data specific to Denmark.
3.14.3 Denmark’s Bioplastics Market and Innovation
- • Industry is concentrated in enzymes and biotech upstream. Novonesis (formed January 2024 via Novozymes–Chr. Hansen merger, Bagsværd) — global leader in industrial enzymes for lactic acid fermentation, a critical upstream input for PLA production.
- • BioBag Denmark (ZENZO A/S, Hilleroed): Produces compostable bags using Novamont’s Mater-Bi resin (EN 13432, OK Compost HOME certified). Effectively an Italian bioplastics demand channel into Denmark.
- • CP Kelco (Lille Skensved): Pectin, carrageenan, microbial polysaccharides as functional additives.
- • DTU (Lyngby): Major research hub for biomass conversion and PHA fermentation.
- • Structurally import dependent for all commodity bioplastics.
3.14.4 Commentary and Insights
- • Denmark’s value is upstream, not downstream. Novonesis supplies the enzymes that enable PLA production globally. Denmark’s bioplastics contribution is invisible in finished product statistics but foundational in the supply chain.
- • The late EPR launch (October 2025) means Denmark is 3–4 years behind France and Germany on packaging producer responsibility infrastructure.
- • High excise duties on bags and tableware create a fiscal moat but the market is small (5.9M population). Volume opportunity is negligible.
3.14.5 Denmark Opportunity Scorecard
| Factor | Score |
| Pillar 1: Regulatory Strength | 3.7 / 5 |
| 1A — Legal Framework Robustness | 4 |
| 1B — Ban Breadth (product categories) | 3 |
| 1C — Future Trajectory | 4 |
| Pillar 2: Enforcement Reality | 3 / 5 |
| Pillar 3: Market Opportunity Gap | 2 / 5 |
| Composite Score | 8.7 / 15 |
Verdict: Denmark’s bioplastics value is upstream. The domestic market is too small for volume entry, and EPR is too new to have created compliance-driven demand. A technology and supply chain partner geography, not a target market.
3.15 COLOMBIA – Single-Use Plastic Ban: Market Opportunity Index
Composite Score: 9.5 / 15 | Global Rank: #10
The most ambitious national SUP ban in the Americas — Phase 1 delivered a measured 61.7% drop in formal-market plastic bag consumption within its first year.
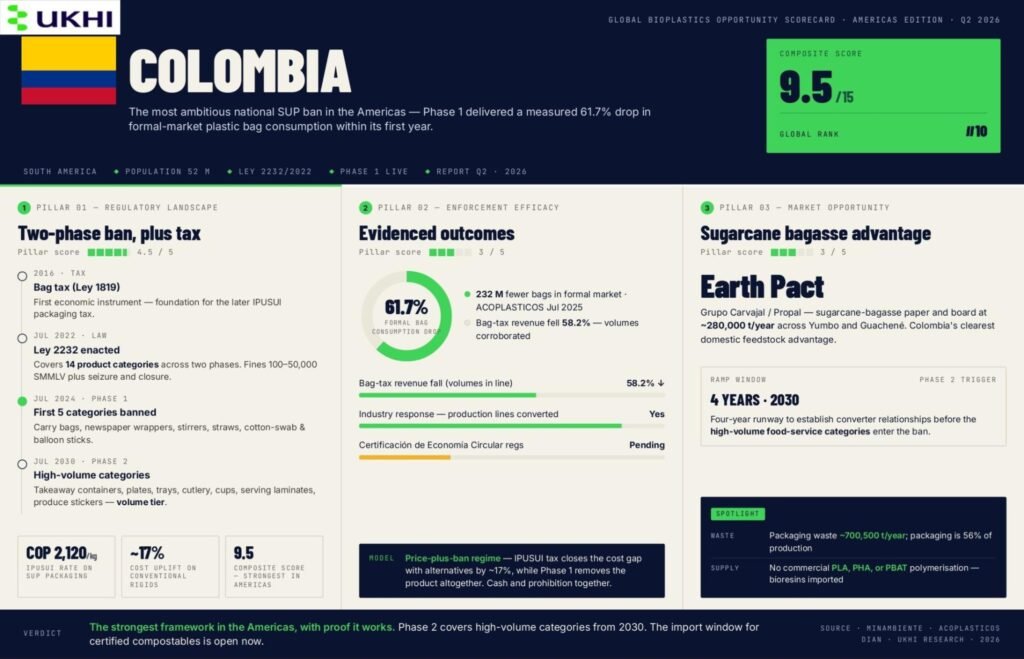
3.15.1 Colombia Plastic Ban Laws and Regulations
- •
Ley 2232 de 2022, enacted July 7, 2022, is Colombia’s core single-use plastic ban law. It covers 14 product categories across two phases:- –
Phase 1 — effective July 7, 2024: Carry bags, newspaper wrappers, drink stirrers and straws, cotton-swab supports, balloon sticks. - –
Phase 2 — effective July 7, 2030: Takeaway food containers and wrappers, plates, trays, cutlery, cups, serving laminates, produce stickers, confetti, and fresh-produce wrappers. This is where the high-volume categories sit.
- –
- •
Colombia plastic ban penalties: 100–50,000 SMMLV (monthly minimum wages) plus seizure and closure. Exemptions cover medical uses, raw animal-food packaging, 100% post-consumer recycled content, reusables, and certified biodegradables meeting Resolución 803/2024 thresholds. - •
Colombia also operates two plastic taxes. - •
The original bag tax (Ley 1819/2016) plus the IPUSUI (Ley 2277/2022) — charged at approximately COP $2,120/kg on SUP packaging, adding roughly 17% to conventional rigid container costs. - •
Both survived constitutional challenge. Certified compostable alternatives qualify for tax exemption — once the implementing Certificación de Economía Circular regulations are finalised. - •
Decreto 2192/2023 extends the ban to protected areas, páramos, and Ramsar wetlands. Colombia is a High Ambition Coalition member and co-sponsor of the UNEA resolution that launched the global plastics treaty.
3.15.2 Colombia Plastic Ban Enforcement Reality
- •
Phase 1 is delivering measurable results. ACOPLASTICOS’ July 2025 review records formal-market bag consumption down 61.7% by volume (232 million fewer bags) with bag-tax revenue falling 58.2% in line. Industry has converted production lines rather than litigate. - •
Key gaps remain. The Certificación de Economía Circular (which determines tax-exemption eligibility) is still unregulated two years after its creation. Biodegradable implementing regulations are incomplete. Public sanctions data from MinAmbiente is limited.
3.15.3 Colombia Plastic Consumption and Bioplastics Market
- •
Colombia plastic consumption: ~1.4 million tonnes/year. Packaging is 56% of production. Packaging waste: ~700,500 t/year. - •
Colombia bioplastics market: Growing rapidly post-Phase 1, but no official market size is published. - •
Key Colombia bioplastics manufacturers:- – Earth Pact / Propal (Grupo Carvajal) — sugarcane-bagasse paper and board, ~280,000 t/year in Yumbo and Guachené. Colombia’s clearest domestic advantage.
- – Biodegradables de Colombia (Biocol) — sugarcane-bagasse disposables, 90-day claimed biodegradation.
- – Cañapack, Purabox, Seedpack — starch and cellulose converters serving major cities.
- •
No commercial PLA, PHA, or PBAT polymerisation exists in Colombia. All bioresins are imported.
3.15.4 Commentary and Insights
- •
The 61.7% bag reduction is a recorded outcome, not a target. It makes Colombia’s Phase 1 the best-evidenced SUP policy success in the Americas. - •
Phase 2 (2030) is where volume lies. Food-service containers, cutlery, and takeaway packaging (the bulk of SUP waste) come under ban in 2030. Suppliers have a four-year runway to establish converter relationships. - •
The IPUSUI tax makes bioplastics cost-competitive faster. At ~17% added cost on conventional rigid packaging, the price gap with certified alternatives shrinks significantly. - •
Sugarcane bagasse is Colombia’s structural feedstock advantage. Valle del Cauca’s sugar industry provides cheap, locally-sourced cellulose that imports cannot match on cost.
3.15.5 Colombia Plastic Ban Opportunity Scorecard
| Factor | Score |
| Pillar 1: Regulatory Strength | 4.5 / 5 |
| 1A — Legal Framework Robustness | 5 |
| 1B — Ban Breadth (product categories) | 4 |
| 1C — Future Trajectory | 5 |
| Pillar 2: Enforcement Reality | 3 / 5 |
| Pillar 3: Market Opportunity Gap | 2 / 5 |
| Composite Score | 9.5 / 15 |
Verdict: Colombia has the strongest SUP ban framework in the Americas and proof it works. Phase 2 covers the high-volume categories from 2030. With zero domestic resin production and a packaging tax penalising conventional plastic, the import window for certified compostable alternatives is open now.
3.16 MEXICO – Single-Use Plastic Ban: Market Opportunity Index
Composite Score: 8.2 / 15 | Global Rank: #19
A unanimous federal EPR law passed in December 2025 — Mexico’s strongest plastic policy signal ever — but city-level enforcement has effectively collapsed.
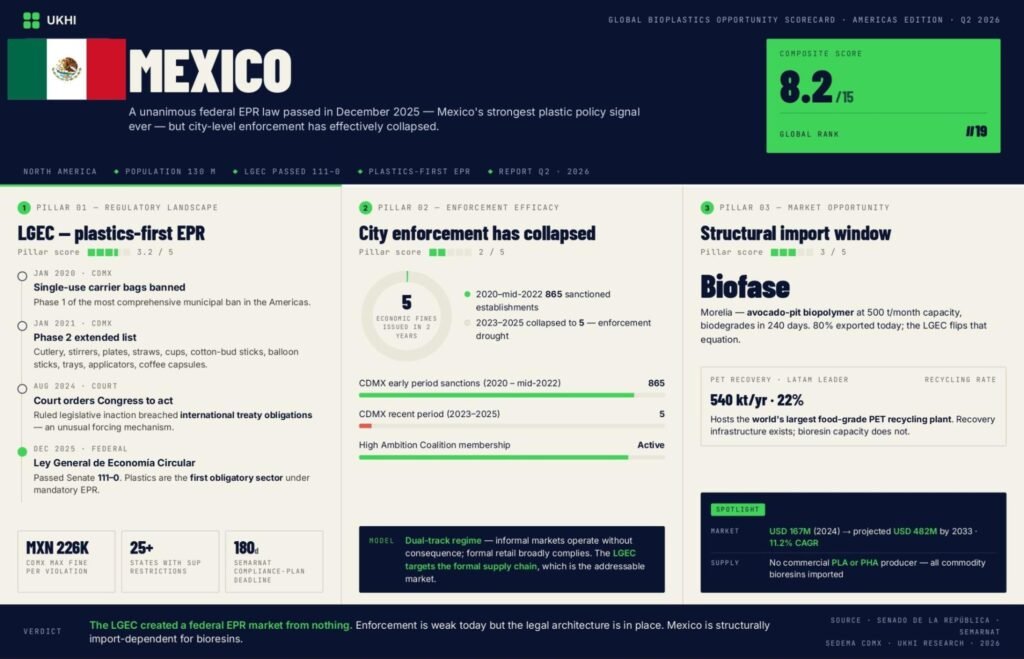
3.16.1 Mexico Plastic Ban Laws and Regulations
- • Mexico had no federal SUP ban until December 10, 2025, when the Senate passed the Ley General de Economía Circular (LGEC) by 111–0. Plastics are the first obligatory sector under mandatory Extended Producer Responsibility. Producers and importers must register compliance plans with SEMARNAT within 180 days.
- • The vote was triggered by an August 2024 court order ruling that legislative inaction on SUP regulation breached Mexico’s international treaty obligations — an unusual legal mechanism that forced Congress to act.
-
•
Mexico City has the most comprehensive municipal ban in the Americas, enacted in two phases:
- – January 2020: Single-use plastic carrier bags banned.
- – January 2021: Cutlery, stirrers, plates, straws, cups and lids, cotton-bud sticks, balloon sticks, food trays, tampon applicators, low-recyclability coffee capsules, and microplastic-containing products all banned.
- • Fines run MXN 56,570–226,280 (500–2,000 UMA at 2025 values) plus closure. Compostable alternatives certified under NMX-E-273-NYCE-2019 are exempt.
- • 25+ Mexican states have SUP restrictions as of 2025. Estado de México introduced fines up to MXN 339,420 in February 2025. Three states (Baja California, Chihuahua, Guanajuato) still have none.
- • Mexico is a High Ambition Coalition member on the UN Plastics Treaty.
3.16.2 Mexico Plastic Ban Enforcement Reality
- • Mexico City enforcement has deteriorated sharply. Early figures (2020–mid-2022) showed 865 sanctioned establishments.
- • By 2025, only 5 economic fines had been issued in two years.
- • Markets and street vendors operate without consequence. The LGEC is too new for federal enforcement infrastructure to exist yet.
3.16.3 Mexico Plastic Consumption and Bioplastics Market
- • Mexico plastic consumption: 6.8 million tonnes/year.
- • Plastics are 12–14% of the ~77 Mt/year municipal waste stream.
- • National recycling rate: 22% (2024).
- • Mexico recovers 540,000 t of PET annually, which is Latin America’s highest, and hosts the world’s largest food-grade PET recycling plant.
- • Mexico bioplastics market size: USD 166.8 million (2024), projected USD 482 million by 2033 at 11.2% CAGR.
-
•
Key Mexico bioplastics manufacturers:
- – Biofase (Morelia) — avocado-pit biopolymer at 500 t/month capacity, biodegrades in 240 days, 80% exported.
- – BioSolutions México / PolyAgave (Nuevo León) — agave and barley-fiber compounds for 3M, Kimberly-Clark, Heineken, José Cuervo.
- • No commercial PLA or PHA producer exists in Mexico. All commodity bioresins are imported.
3.16.4 Commentary and Insights
- • The LGEC is the real demand catalyst. A unanimous Senate vote and plastics-first EPR designation will restructure formal-sector procurement, likely from 2027.
- • Enforcement collapse is not a dealbreaker. Formal retail broadly complies. The LGEC targets the formal supply chain, which is the addressable market for a bioplastics supplier.
- • Import dependency is structural and immediate. No domestic PLA or PBAT polymerisation capacity exists. Growing ban-driven demand makes Mexico an open import market for certified compostable resins right now.
3.16.5 Mexico Plastic Ban Opportunity Scorecard
| Factor | Score |
| Pillar 1: Regulatory Strength | 3.2 / 5 |
| 1A — Legal Framework Robustness | 3 |
| 1B — Ban Breadth (product categories) | 4 |
| 1C — Future Trajectory | 3 |
| Pillar 2: Enforcement Reality | 2 / 5 |
| Pillar 3: Market Opportunity Gap | 3 / 5 |
| Composite Score | 8.2 / 15 |
Verdict: The December 2025 LGEC created a federal EPR market from nothing. Enforcement is weak today but the legal architecture is now in place. Mexico is structurally import-dependent for bioresins.
3.17 CANADA – Single-Use Plastic Ban: Market Opportunity Index
Composite Score: 8.0 / 15 | Global Rank: #20
Federal SUP bans survived a near-death court challenge; the January 2026 Federal Court of Appeal reversal restored the legal foundation, but the bioplastics supply base remains at pilot scale.
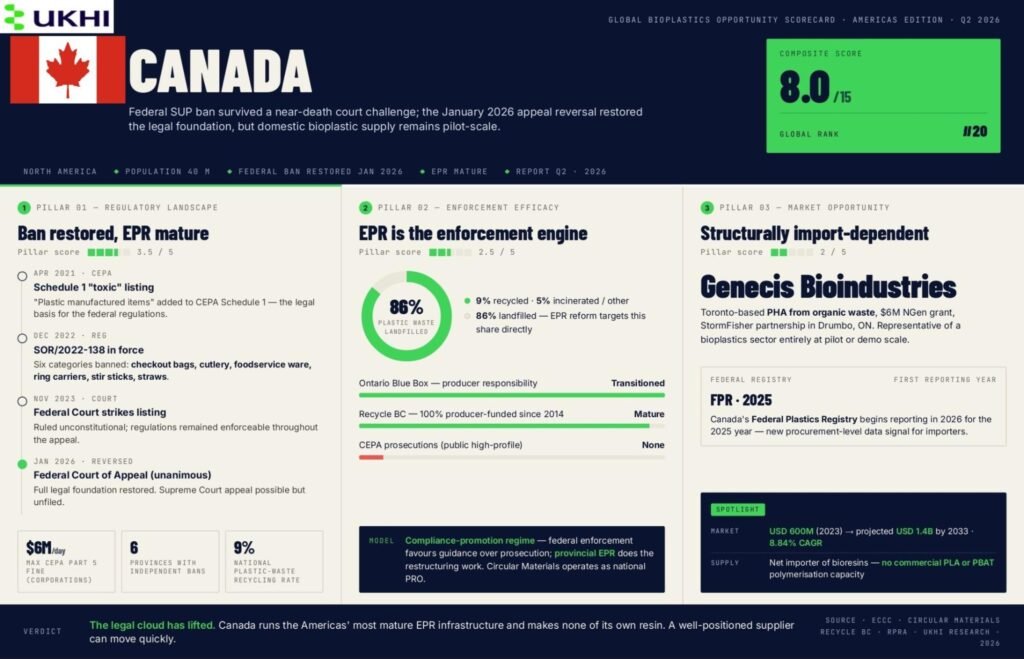
3.17.1 Canada Plastic Ban Laws and Regulations
- • Canada’s Single-Use Plastics Prohibition Regulations (SOR/2022-138) took effect December 20, 2022, banning manufacture and import of six categories:
- • What’s banned: Checkout bags, plastic cutlery (PS/PE/PP/PET/ABS/oxo-degradable), problematic foodservice ware (EPS, PVC, carbon-black, oxo-degradable), ring carriers, stir sticks, and non-flexible straws.
- • Exemptions: Flexible straws allowed only in non-commercial settings, medical/long-term care facilities, and on-request retail (not displayed). Exemptions are notably tight compared to other G7 nations.
- • The regulations sit on the CEPA Schedule 1 toxic listing of “plastic manufactured items” (April 2021). In November 2023, the Federal Court struck down that listing as unconstitutional.
- • On January 30, 2026, the Federal Court of Appeal unanimously reversed that decision — restoring the full legal foundation.
- • A Supreme Court appeal remained possible but had not been filed at time of writing.
- • Canada’s penalties under CEPA Part 5: up to $1 million/day (individuals) and $6 million/day (large corporations) plus up to 3 years imprisonment on indictment.
-
•
Provincial bans operate independently:
- – PEI (July 2019 — Canada’s first)
- – Newfoundland & Labrador (October 2020)
- – Nova Scotia (October 2020, fines up to $10,000)
- – Yukon (January 2022)
- – BC’s CleanBC phased bans (2023–24)
- – 75+ municipal bylaws.
- • Canada’s Federal Plastics Registry begins reporting in 2026 for the 2025 year.
3.17.2 Canada Plastic Ban Enforcement Reality
- • Federal enforcement has favoured compliance promotion over prosecution as no high-profile CEPA prosecutions have been publicly reported.
- • The regulations remained enforceable throughout the litigation period and are now on firmer legal ground post-January 2026.
- • Provincial bans run smoothly; Nova Scotia issued compliance advisories at rollout, PEI relies on voluntary compliance.
- • EPR is Canada’s enforcement strength: Ontario Blue Box fully transitioned to producer responsibility (2023–2025), Recycle BC has been 100% producer-funded since 2014, and Circular Materials operates as national PRO across six provinces.
3.17.3 Canada Plastic Consumption and Bioplastics Market
- • Canada plastic consumption: 6.2 million tonnes annually. Packaging is the largest category at 2.3 Mt. Only 9% of 3.3 Mt of plastic waste is recycled; ~86% is landfilled.
- • Canada bioplastics market size: ~USD 600 million (2023), projected USD 1.4 billion by 2033 at 8.84% CAGR.
-
•
Canada bioplastics manufacturers — all at pilot or demo scale:
- – Genecis Bioindustries (Toronto) — PHA from organic waste, $6M NGen grant, StormFisher partnership in Drumbo, ON.
- – TerraVerdae Bioworks (Edmonton) — PHA resins, films, and coatings.
- – BOSK Bioproducts (Quebec) — TÜV-certified REGEN PHA blends.
- – good natured Products (BC) — displaced 30+ million pounds of plastic through 2023.
- • Canada is a net importer of bioplastic resins: PLA from NatureWorks and Thailand, bio-PE from Braskem Brazil, domestic PHA at pilot scale only.
3.17.4 Commentary and Insights
- • The court saga resolved in favour of the ban is a meaningful green light for procurement teams and suppliers who were waiting out the litigation.
- • EPR is more important than the ban for demand creation. Ontario and BC’s producer-responsibility programs are restructuring packaging procurement at scale regardless of what the courts do.
- • Domestic supply is the gap. With all Canadian bioplastic producers at pilot scale and no commercial PLA or PBAT polymerisation capacity, import opportunity is real and immediate.
- • Canada punches above its weight on treaty leadership. Hosting INC-4 in Ottawa and co-founding the Host Country Alliance signals sustained regulatory ambition.
3.17.5 Canada Plastic Ban Opportunity Scorecard
| Factor | Score |
| Pillar 1: Regulatory Strength | 3.5 / 5 |
| 1A — Legal Framework Robustness | 4 |
| 1B — Ban Breadth | 3 |
| 1C — Future Trajectory | 3 |
| Pillar 2: Enforcement Reality | 2.5 / 5 |
| Pillar 3: Market Opportunity Gap | 2 / 5 |
| Composite Score | 8.0 / 15 |
Verdict: The legal cloud has lifted. Canada’s EPR infrastructure is the Americas’ most mature, and with zero domestic resin production at commercial scale, it is structurally import-dependent. A well-positioned supplier can move quickly.
3.18 BRAZIL – Single-Use Plastic Ban: Market Opportunity Index
Composite Score: 7.5 / 15 | Global Rank: #23
Home to the world’s largest bio-PE plant — yet most of it is exported, federal ban legislation is stalled, and 33 million tonnes of waste still receive inappropriate disposal each year.
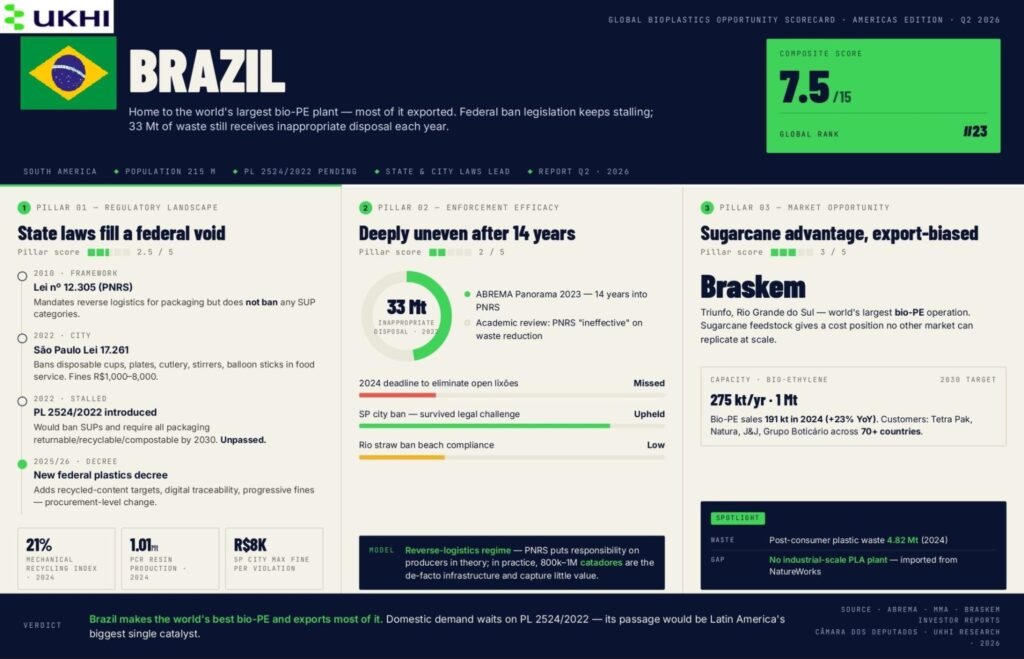
3.18.1 Brazil Plastic Ban Laws and Regulations
- • Brazil has no comprehensive national single-use plastic ban. The framework rests on Lei nº 12.305/2010 (Política Nacional de Resíduos Sólidos), which mandates reverse logistics for packaging but does not ban SUP categories. Decreto 10.936/2022 regulated PNRS and created national reverse logistics targets.
- • A new federal plastics decree (late 2025/early 2026) adds mandatory reduction and recycling targets, recycled content requirements, digital traceability, and progressive fines.
- • PL 2524/2022, which would ban disposable SUPs and require all packaging to be returnable, recyclable, or compostable by 2030, remains unpassed.
-
•
State and city laws fill the national gap:
- – São Paulo city Lei 17.261/2020 (in force January 2021) — bans disposable cups, plates, cutlery, stirrers, balloon sticks in food service. Fines: R$1,000–R$8,000 plus closure.
- – São Paulo state Lei 17.453/2021 — extends restrictions statewide.
- – Rio de Janeiro Lei 8.006/2018 — plastic bag ban. Lei 9.529/2022 extends to cups, cutlery, stirrers. City straw ban (Lei 6.458/2019) upheld by TJ-RJ 2021, fines R$3,000–6,000.
- – Rio Grande do Sul Lei 15.046/2017 — phased bag replacement.
- • Brazil’s penalty framework is fragmented across state laws; no uniform federal fine structure for SUP violations exists yet.
3.18.2 Brazil Plastic Ban Enforcement Reality
- • PNRS implementation is deeply uneven after 14 years. ABREMA’s Panorama 2023 reports ~33 million tonnes of waste received environmentally inappropriate disposal in 2022.
- • The 2024 federal deadline to eliminate open lixões was widely missed. Academic reviews conclude PNRS has been “ineffective in reducing waste generation and increasing plastic recyclability.”
- • São Paulo’s city ban survived legal challenge but enforcement was blunted by COVID-era disposable preferences as actual fines issued have been few.
- • Rio’s straw ban was upheld unanimously by TJ-RJ, yet journalists documented widespread beach non-compliance. Brazil’s 800,000–1,000,000 waste-pickers (catadores) remain the backbone of recycling but capture little value.
3.18.3 Brazil Plastic Consumption and Bioplastics Market
- • Brazil plastic consumption: 7–8 million tonnes of transformed plastics annually. Post-consumer plastic waste: 4.82 million tonnes (2024). Mechanical recycling index reached 21% in 2024, with PCR resin production hitting 1.012 Mt.
- • Brazil bioplastics manufacturers — dominated by one player:
-
•
Braskem “I’m green” bio-PE — world’s largest bio-polyethylene operation in Triunfo, Rio Grande do Sul.
- – Capacity 275,000 t/year green ethylene (as of May 2025, up 37% since 2010)
- – Bio-PE sales: 191,000 t in 2024 (+23% YoY)
- – Target: 1 million t/year biobased capacity by 2030
- – Customers include Tetra Pak, Natura, Johnson & Johnson, Grupo Boticário across 70+ countries.
- • PHB Industrial (Biocycle®) — Brazil’s sole notable PHA/PHB producer, from sugarcane in Serrana, SP.
- • Suzano — world’s largest pulp producer, launched Greenpack biodegradable paper, invested up to US$5M in Canadian startup Bioform Technologies.
- • No industrial-scale PLA plant operates in Brazil. PLA is imported from NatureWorks.
3.18.4 Commentary and Insights
- • Brazil’s paradox mirrors the USA’s — world-leading bioplastic production capacity without a federal ban creating domestic demand. Most Braskem bio-PE is exported.
- • PL 2524/2022 passing would be a market-restructuring event. If it clears the Senate, Brazil’s 200+ million population becomes an active demand market for alternatives.
- • The 2025/2026 federal plastics decree is underrated. Mandatory recycled-content requirements and digital traceability are procurement-level changes that will move even without a full ban.
- • Sugarcane is Brazil’s structural advantage — cheap bio-ethanol feedstock underpins Braskem’s cost position globally. No other market can replicate this at scale.
- • Brazil slowed UN Plastics Treaty progress at INC-5.1 Busan. This signals continued domestic resistance to binding global polymer caps.
3.18.5 Brazil Plastic Ban Opportunity Scorecard
| Factor | Score |
| Pillar 1: Regulatory Strength | 2.5 / 5 |
| 1A — Legal Framework Robustness | 3 |
| 1B — Ban Breadth | 2 |
| 1C — Future Trajectory | 2 |
| Pillar 2: Enforcement Reality | 2 / 5 |
| Pillar 3: Market Opportunity Gap | 3 / 5 |
| Composite Score | 7.5 / 15 |
Verdict: Brazil makes the world’s best bio-PE and exports most of it. The domestic opportunity waits on federal legislation that keeps stalling. Track PL 2524/2022 as its passage would be the single biggest demand catalyst in Latin American bioplastics.
3.19 UNITED STATES – Single-Use Plastic Ban: Market Opportunity Index
Composite Score: 6.5 / 15 | Global Rank: #24
The world’s largest plastic consumer with no federal ban and a flagship bioplastics producer that just went bankrupt; federal retreat is creating a state-level patchwork that still represents real demand.
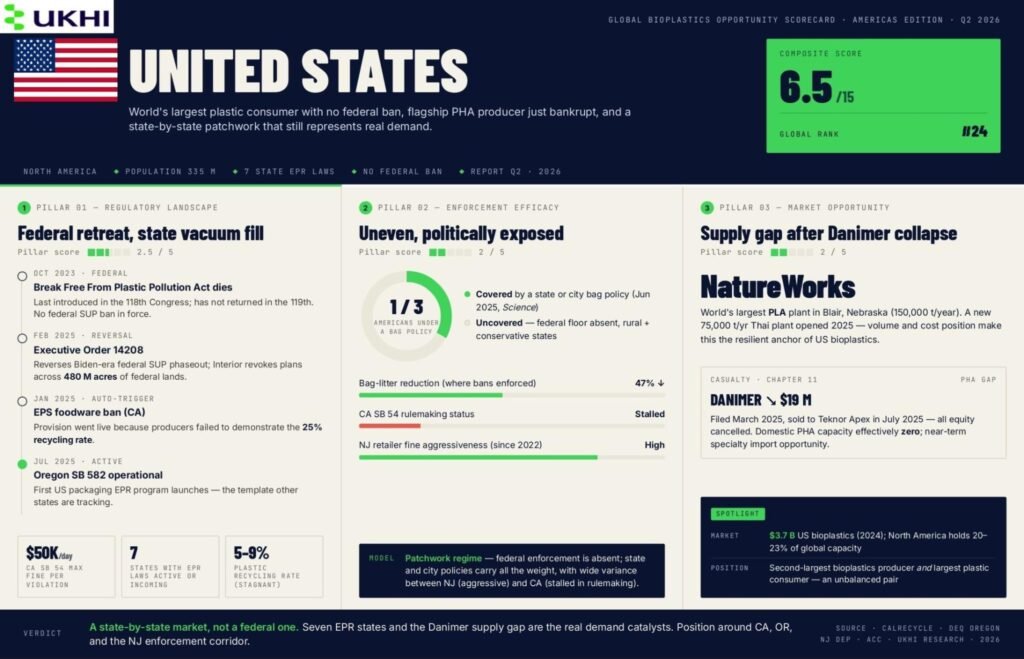
3.19.1 USA Plastic Ban Laws and Regulations
- • The USA has no federal single-use plastic ban. The Break Free From Plastic Pollution Act, last introduced in October 2023, died in committee and has not returned in the 119th Congress.
- • In February 2025, Executive Order 14208 reversed Biden-era federal SUP phaseout policy. Interior Secretary Burgum followed by revoking phaseout plans across 480 million acres of federal lands.
-
•
State law fills the vacuum. Seven states now have operational or incoming packaging EPR laws:
- – California SB 54 (2022): 25% SUP source reduction, 65% recycling, 100% recyclable/compostable packaging by 2032. Fines up to $50,000/day per violation. Currently in rulemaking crisis — CalRecycle missed its March 2025 deadline, withdrew revised rules in January 2026.
- – Oregon SB 582 (2021): First US packaging EPR to go operational, launched July 1, 2025.
- – New Jersey: Strictest state ban with plastic AND paper bags banned in stores over 2,500 sq ft. Fines escalate from $1,000 to $10,000.
- – Further EPR laws active in Maine, Colorado, Minnesota, Maryland, and Washington.
- • What’s banned varies by state but broadly converges on: thin carry-out bags, expanded polystyrene foodware, plastic straws (usually on-request only), stirrers, and hotel mini-toiletries. Medical use, pharmacy bags, raw produce bags, and disability exemptions (straws) are standard carve-outs.
- • The USA has no federal plastics tax.
- • At the UN Global Plastics Treaty, the Trump administration reversed Biden’s support for production caps in January 2025 and reportedly threatened tariff consequences for high-ambition countries at INC-5.2 Geneva in August 2025, where talks collapsed.
3.19.2 USA Plastic Ban Enforcement Reality
- • A June 2025 Science study found roughly one-third of Americans now live under some bag policy, and comprehensive bans have cut plastic bag litter by up to 47% where enforced.
- • Enforcement is uneven and politically exposed.
- • California’s SB 54 is stalled: Governor Newsom rejected CalRecycle’s draft rules in March 2025, citing $36 billion in estimated costs.
- • The January 1, 2025 EPS foodware ban did auto-trigger because producers failed to demonstrate a 25% recycling rate — that provision is live. New Jersey has been most aggressive with retailer fines since 2022.
3.19.3 USA Plastic Consumption and Bioplastics Market
- • USA plastic consumption: ~84.3 million metric tonnes annually. Per-capita plastic waste runs ~130 kg/year — 2 to 8 times other nations. Recycling stagnates at 5–9%.
- • USA bioplastics market size: ~$3.7 billion (2024). North America holds 20–23% of global bioplastics capacity.
-
•
USA bioplastics manufacturers:
- – NatureWorks — world’s largest PLA plant in Blair, Nebraska (150,000 t/year), plus a new 75,000 t/year plant starting in Thailand 2025.
- – Danimer Scientific — filed Chapter 11 in March 2025, sold to Teknor Apex for ~$19 million in July 2025. All equity cancelled.
- – Newlight Technologies — AirCarbon PHB from methane.
- – RWDC Industries — Solon PHA, Athens GA, plus a 10,000 t/year Greek plant started December 2024.
- • The pattern is stark: the USA is simultaneously the world’s largest plastic consumer and holds second-largest bioplastics production capacity, yet its flagship PHA producer collapsed at the exact moment federal policy support was withdrawn.
3.19.4 Commentary and Insights
- • State EPR is the real demand signal. California, Oregon, and six other states are building compliance infrastructure regardless of Washington.
- • The Danimer collapse is a warning. PHA economics remain fragile without policy pull.
- • NatureWorks’ PLA business is structurally different — volume, cost position, and global customer base make it resilient.
- • Federal retreat opens import opportunity. With domestic PHA capacity gone and NatureWorks focused on Thailand expansion, the US market has a near-term specialty bioplastics supply gap.
- • The 2027–2032 state EPR wave is real. Seven operational or incoming EPR programs will mandate recycled content and recyclability.
3.19.5 USA Plastic Ban Opportunity Scorecard
| Factor | Score |
| Pillar 1: Regulatory Strength | 2.5 / 5 |
| 1A — Legal Framework Robustness | 3 |
| 1B — Ban Breadth | 2 |
| 1C — Future Trajectory | 2 |
| Pillar 2: Enforcement Reality | 2 / 5 |
| Pillar 3: Market Opportunity Gap | 2 / 5 |
| Composite Score | 6.5 / 15 |
Verdict: Federal retreat masks real state-level momentum. The opportunity is concentrated in the seven EPR states and the supply gap left by Danimer’s collapse.
3.20 UAE – Single-Use Plastic Ban: Market Opportunity Index
Composite Score: 10.3 / 15 | Global Rank: #7
The fastest-moving oil-producing nation on SUP bans — a clear phased federal regime and the world’s largest PLA plant under construction.
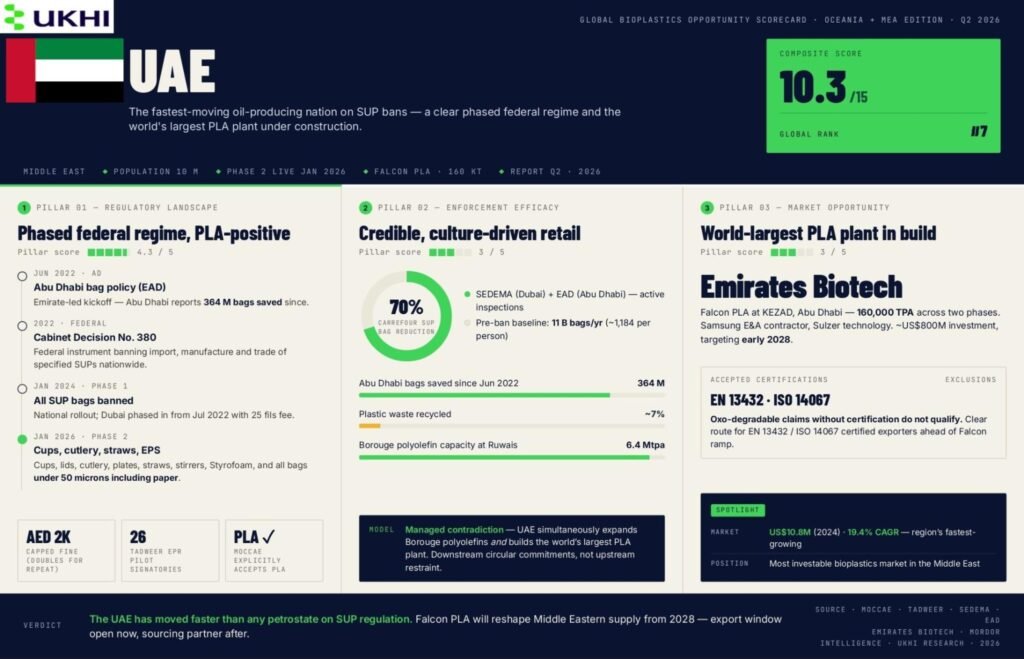
Compostable Packaging for Injection Molding – Recent Funding, M&A and Capacity Expansions
The significant transactions and capacity commitments of 2022 to 2025 are summarised below.
| Transaction | Date | Value | What happened |
|---|---|---|---|
| TIPA Series C | January 2022 | $70 million | Compostable flexible packaging; led by Millennium Food-Tech and Meitav Dash. Total raised across six rounds: approximately $121 million. |
| Versalis (Eni) acquires Novamont | October 2023 | Undisclosed | Eni’s chemicals arm purchased the remaining 64% of Novamont, consolidating Europe’s leading compostable starch-blend producer. |
| NatureWorks Thailand | Ongoing; green loan May 2024 | >$600 million total | 75,000 t/yr integrated PLA facility; $350 million green loan from Krungthai Bank; full production targeted 2025 to 2026. |
| Emirates Biotech / Sulzer, UAE | Technology licence December 2024; equipment contract May 2025 | ~$800 million total | 160,000 t/yr PLA facility in two phases at KEZAD, Abu Dhabi. Sulzer Chemtech is the technology licensor; Samsung E&A is EPC contractor. Phase 1 commissioning targeted early 2028. Would be the world’s largest single PLA site. |
| Ukhi, India | December 2024 | $1.2 million (pre-seed) | Pre-seed round led by 100Unicorns, with participation from Venture Catalysts and angel investor Avtar Monga, plus debt financing from SIDBI (Small Industries Development Bank of India). |
| Balrampur Chini Mills, India | Announced 2025; capex revised 2025 | ~$370 million | 80,000 t/yr PLA plant at Kumbhi, Uttar Pradesh using local sugarcane. India’s first industrial-scale PLA facility; commercial production target December 2027. |
| Teknor Apex acquires Danimer Scientific | July 2025 | $19 million | Distressed acquisition out of Chapter 11. Assets include the Winchester, Kentucky PHA facility, a laboratory and pilot plant in Bainbridge, Georgia, and 480+ patents across 20+ countries. |
Insight: Three of the four largest announced PLA capacity additions (Emirates Biotech UAE, NatureWorks Thailand, Balrampur Chini India) are outside Europe. If all three reach nameplate capacity by 2028 to 2029, global PLA supply will roughly double. Combined with Chinese additions, this creates significant downward price pressure, which could accelerate adoption in cost-sensitive applications but will squeeze margins for pure-play producers.
3.20.1 UAE’s Single-Use Plastic Ban: Laws and Regulations
- • Federal instrument: Cabinet Decision No. 380 of 2022 bans import, manufacture and trade of specified SUPs nationwide.
- • Phase 1 (January 2024): all single-use plastic bags.
- • Phase 2 (January 2026): cups, lids, cutlery, plates, straws, stirrers, Styrofoam containers, and all bags under 50 microns including paper.
- • Abu Dhabi led from June 2022 (EAD policy). Dubai phased in from July 2022 (25 fils fee) through January 2026. Penalties: AED 200 per violation, doubling for repeats, capped at AED 2,000.
- • Exemptions: Medical bags, refuse bags, fresh-food wraps, large bags for clothing/electronics. PLA products are explicitly recognised as permitted substitutes by MOCCAE.
- • EPR pilot launched with Tadweer Group covering packaging, electronics and batteries. 26 signatories including Carrefour, Lulu, Tetra Pak.
3.20.2 UAE’s Plastic Ban Enforcement
- • Abu Dhabi reports 364 million bags saved since June 2022. Carrefour reports 70% SUP bag reduction post-ban.
- • The tension: UAE hosts the 5 Mtpa Borouge polyolefin complex at Ruwais (expanding to 6.4 Mtpa). The contradiction is managed through downstream circular commitments, not upstream restraint.
- • Enforcement is credible. Multiple emirate-level agencies (SEDEMA in Dubai, EAD in Abu Dhabi) conduct inspections. Fines are low but compliance is culture-driven in the retail sector.
3.20.3 UAE’s Bioplastics Market and Manufacturers
- • Plastic waste: ~3.2 Mt/year, only ~7% recycled. Pre-ban: 11 billion bags/year (~1,184 per person).
- • Bioplastics market: ~US$10.8M (2024), 19.4% CAGR (Mordor Intelligence) — region’s fastest-growing.
- • Emirates Biotech’s Falcon PLA plant at KEZAD, Abu Dhabi: 160,000 TPA across two phases. Samsung E&A as contractor, Sulzer technology. ~US$800M investment, targeting early 2028. Would become the world’s largest single-site PLA facility.
- • Import dependent today for PLA and PBAT. Accepted certifications: EN 13432, ISO 14067. Oxo-degradable claims without certification do not qualify.
3.20.4 Commentary and Insights
- • The UAE is the most investable bioplastics market in the Middle East. Clear phased bans, explicit PLA acceptance, credible enforcement, and the Emirates Biotech mega-plant create a complete ecosystem by 2028.
- • The oil-economy contradiction is real but managed. The UAE is simultaneously expanding Borouge (6.4 Mtpa polyolefins) and building the world’s largest PLA plant.
3.20.5 UAE Opportunity Scorecard
| Factor | Score |
| Pillar 1: Regulatory Strength | 4.3 / 5 |
| 1A — Legal Framework Robustness | 4 |
| 1B — Ban Breadth (product categories) | 5 |
| 1C — Future Trajectory | 4 |
| Pillar 2: Enforcement Reality | 3 / 5 |
| Pillar 3: Market Opportunity Gap | 3 / 5 |
| Composite Score | 10.3 / 15 |
Verdict: The UAE has moved faster than any petrostate on SUP regulation. The Emirates Biotech PLA mega-plant will reshape Middle Eastern bioplastics supply from 2028 and create a window of opportunity for exporters until then and a potential sourcing partner after.
3.21 AUSTRALIA – Single-Use Plastic Ban: Market Opportunity Index
Composite Score: 10.0 / 15 | Global Rank: #8
Eight state-level bans converging toward a federal mandatory EPR — strong certification standards and a structural 64% recycling shortfall that creates genuine pull for bio-based alternatives.
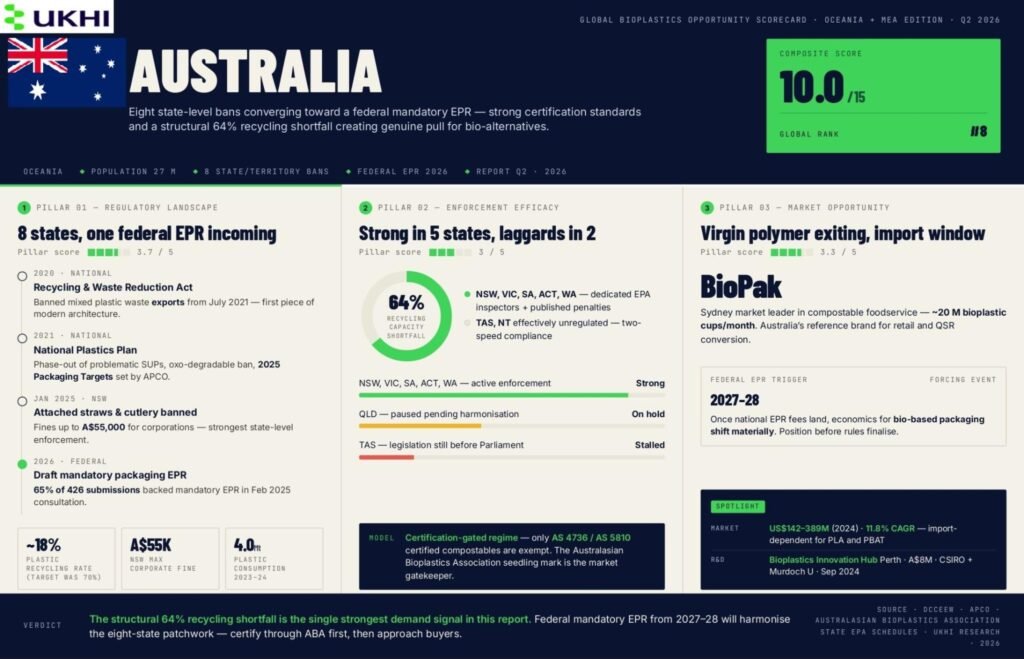
3.21.1 Australia’s Single-Use Plastic Ban: Laws and Regulations
3.21.1.1 Key Laws Governing Australia’s Plastic Ban
- • National framework: The National Plastics Plan 2021 committed to phasing out problematic SUPs, banning oxo-degradable plastics, and hitting 2025 National Packaging Targets. The Recycling and Waste Reduction Act 2020 banned mixed plastic waste exports from July 2021.
- • APCO (Australian Packaging Covenant Organisation) administers the 2025 National Packaging Targets: 100% reusable/recyclable/compostable packaging, 70% plastic packaging recycled, 50% recycled content. Both APCO and DCCEEW now acknowledge these targets will not be met, as plastic recycling sits at ~18%.
- • Federal EPR coming: A February 2025 consultation showed 65% of 426 submissions backed mandatory EPR. Draft regulations for a national mandatory packaging EPR are expected Q1–Q2 2026.
3.21.1.2 Which Plastic Items Are Banned in Australia?
- • All eight states and territories now have SUP bans, though scope varies. Common banned items across most jurisdictions: lightweight bags, straws, stirrers, cutlery, plates, EPS foodware, cotton bud sticks, oxo-degradable plastics.
- • South Australia led from 2020 and added further items from September 2025. NSW banned attached straws and cutlery from January 2025 (fines up to A$55,000 for corporations). Victoria bans attached straws and pre-packaged EPS from January 2026 (fines up to A$55,476). Queensland has paused further bans pending national harmonisation (max fine ~A$6,893). Western Australia extends bans to dry-goods bags from October 2025. Tasmania and Northern Territory remain laggards, with Tasmania’s legislation still before Parliament.
3.21.1.3 Australia’s Plastic Ban Timeline and Future Goals
- • 2025 National Packaging Targets largely unmet. APCO reporting continues.
- • 2026: Draft federal mandatory packaging EPR expected.
- • Certification: All compostable claims must meet AS 4736 (industrial) or AS 5810 (home), administered by the Australasian Bioplastics Association via the seedling logo. Australia is also a High Ambition Coalition member pushing for binding production caps under the UN Global Plastics Treaty.
3.21.2 Australia’s Plastic Ban Enforcement: Ground Reality
- • Enforcement is strong in NSW, Victoria, SA, ACT and WA with dedicated EPA inspectors and published penalty schedules.
- • Tasmania and the Northern Territory are effectively unregulated at statewide level, creating a two-speed compliance environment.
- • State bans cover bioplastic and degradable variants alongside conventional plastics. Only AS 4736/5810 certified compostable products are exempt, and even these exemptions are narrowing.
3.21.3 Australia’s Bioplastics Market Size and Manufacturers
- • Plastic consumption: 4.0 Mt in 2023–24 (DCCEEW).
- • Domestic virgin polymer production has nearly exited; only polypropylene is still made onshore (since October 2024).
- • Bioplastics market: Estimated at ~US$142–389 million (2024), growing 11.8% CAGR.
-
•
Key players:
- – BioPak (Sydney — market leader in compostable foodservice, ~20M bioplastic cups monthly)
- – SECOS Group/MyEco (ASX:SES — ~10,000 TPA resin capacity)
- – Plantic Technologies (Kuraray-owned — corn-starch biopolymer for Coles meat trays)
- • Import dependent for PLA and PBAT resins. The Bioplastics Innovation Hub launched in Perth (September 2024) with A$8M from CSIRO and Murdoch University.
3.21.4 Commentary and Insights
- • Australia’s 64% recycling capacity shortfall is the single strongest structural demand signal in this report. With domestic virgin polymer production exiting and recycling infrastructure falling far short of waste volumes, bioplastics have a genuine cost-competitiveness path.
- • The coming federal mandatory EPR will be the forcing event. Once national EPR fees land (likely 2027–28), the economics for bio-based packaging will shift materially.
- • AS 4736/5810 certification is non-negotiable for market entry. Australia’s certification regime is among the most rigorous globally. Any bioplastics exporter must certify through the Australasian Bioplastics Association before approaching Australian buyers.
3.21.5 Australia Opportunity Scorecard
| Factor | Score |
| Pillar 1: Regulatory Strength | 3.7 / 5 |
| 1A — Legal Framework Robustness | 4 |
| 1B — Ban Breadth (product categories) | 4 |
| 1C — Future Trajectory | 3 |
| Pillar 2: Enforcement Reality | 3 / 5 |
| Pillar 3: Market Opportunity Gap | 3.3 / 5 |
| Composite Score | 10.0 / 15 |
Verdict: Australia’s eight-state patchwork creates complexity but the direction is toward a national mandatory EPR that will harmonise and tighten requirements from 2027–28. The structural 64% recycling shortfall, near-total exit of domestic virgin polymer production, and rigorous AS 4736/5810 certification regime create a genuine premium-market opportunity for certified bioplastics.
3.22 SOUTH AFRICA – Single-Use Plastic Ban: Market Opportunity Index
Composite Score: 8.3 / 15 | Global Rank: #18
Africa’s most functional EPR system — strong on recycled-content mandates, weak on consumer-level bans, and structurally biased toward mechanical recycling over bio-based substitution.
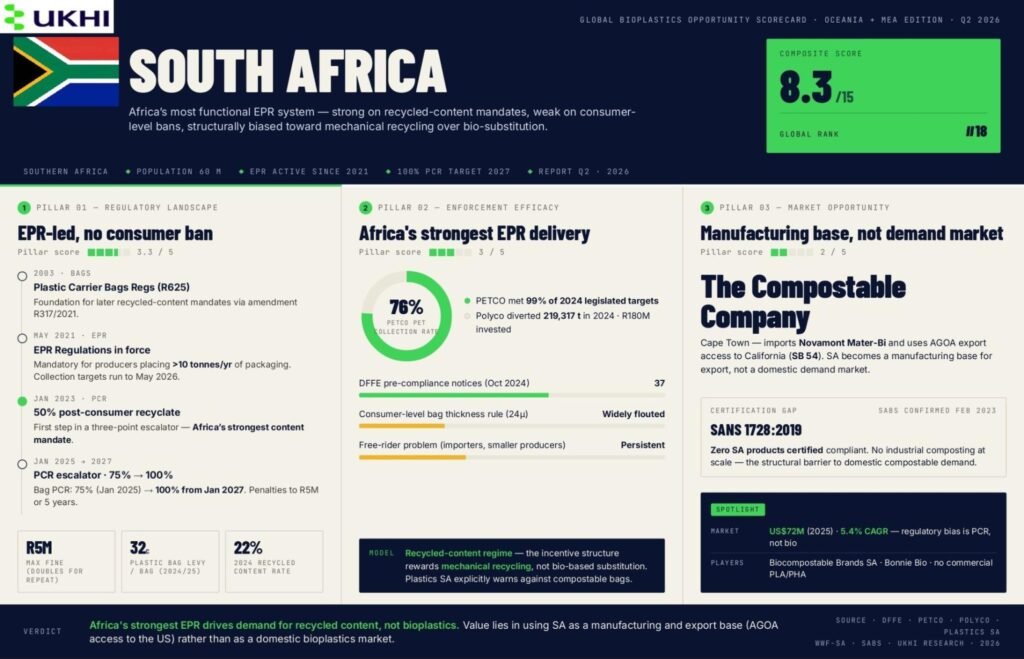
3.22.1 South Africa’s Single-Use Plastic Ban: Laws and Regulations
- • No comprehensive national SUP ban. The regulatory approach is EPR and recycled-content mandates, not product bans.
-
•
Plastic Carrier Bags Regulations (GN R625 of 2003, amended GN R317 of 2021): Mandates post-consumer recyclate:
- – 50% from January 2023
- – 75% from January 2025
- – 100% from January 2027
- • Penalties: up to R5 million or 5 years imprisonment, doubling for repeats.
- • EPR Regulations (GN R1184, effective May 2021): Mandatory for producers placing >10 tonnes/year of packaging. Current collection targets run to May 2026.
- • Plastic bag levy: 32 cents/bag (2024/25) — up from 3 cents at inception in 2004. Funds no longer earmarked to industry.
- • No items specifically banned nationally. WWF-SA recommended bans on stirrers, straws, oxo-additives and microbeads in 2023 — none gazetted as of April 2026.
3.22.2 South Africa’s Plastic Ban Enforcement
- • EPR enforcement is Africa’s strongest. PETCO met 99% of 2024 legislated targets, pushed PET collection to 76%. Polyco diverted 219,317 tonnes in 2024, invested R180M, and paid R37M to communities via Packa-Ching buy-back. DFFE issued 37 pre-compliance notices in October 2024.
- • Consumer-level bag enforcement is weak. The thickness rule (24 microns) is widely flouted. The 2004 levy produced a ~90% short-term consumption drop that reversed over time.
- • Free-rider problem persists — especially among importers and smaller producers who avoid EPR registration.
3.22.3 South Africa’s Bioplastics Market and Manufacturers
- • Plastic consumption: ~1,568 kt virgin polymer (2023). Plastic waste: ~2.4 Mt/year. Recycling: 471,000 tonnes in 2024 (22% circular content).
- • Bioplastics market: ~US$72M (2025), 5.4% CAGR. Regulatory bias is toward recycled content, not bio-based substitution.
-
•
Local producers:
- – Biocompostable Brands SA (potato-starch)
- – The Compostable Company (Cape Town — imports Novamont Mater-Bi, uses AGOA export access to California)
- – Bonnie Bio (certified compostable bags)
- • No commercial-scale PLA/PHA production. All resins imported.
- • Critical gap: Zero SA products certified compliant with SANS 1728:2019 as of February 2023 (SABS confirmed). No industrial composting at scale. Plastics SA explicitly warns against compostable bags as a solution.
3.22.4 Commentary and Insights
- • South Africa’s EPR is the B2B story, not the consumer story. PETCO and Polyco are genuine success stories, but they drive demand for recycled content, not bioplastics. The regulatory incentive structure rewards mechanical recycling.
- • The AGOA export angle is interesting. Companies like The Compostable Company are using SA’s trade access to the US market — particularly California’s SB 54 — as a route for compostable packaging. This makes SA a manufacturing base for export, not a domestic demand market.
3.22.5 South Africa Opportunity Scorecard
| Factor | Score |
| Pillar 1: Regulatory Strength | 3.3 / 5 |
| 1A — Legal Framework Robustness | 4 |
| 1B — Ban Breadth (product categories) | 2 |
| 1C — Future Trajectory | 4 |
| Pillar 2: Enforcement Reality | 3 / 5 |
| Pillar 3: Market Opportunity Gap | 2 / 5 |
| Composite Score | 8.3 / 15 |
Verdict: Africa’s strongest EPR drives demand for recycled content, not bioplastics. The consumer-level ban is absent and composting infrastructure non-existent. Value lies in using SA as a manufacturing and export base (AGOA access to the US) rather than as a domestic bioplastics market.
3.23 KENYA – Single-Use Plastic Ban: Market Opportunity Index
Composite Score: 8.0 / 15 | Global Rank: #21
The world’s most famous plastic bag ban; but porous borders, a suspended EPR, and no composting infrastructure mean reputation far exceeds reality.
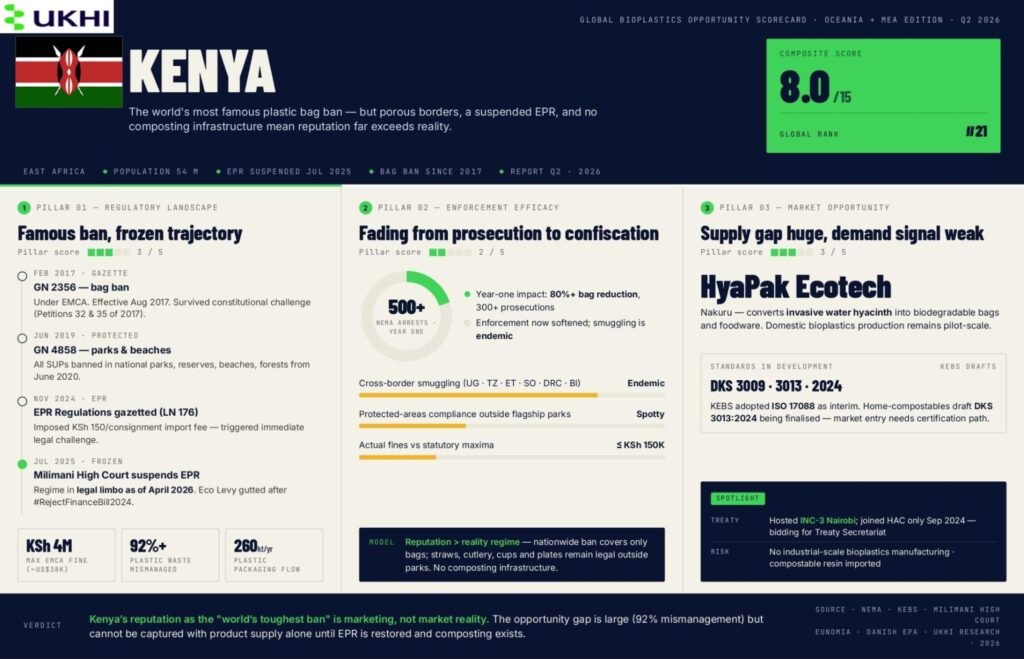
3.23.1 Kenya’s Single-Use Plastic Ban: Laws and Regulations
3.23.1.1 Key Laws Governing Kenya’s Plastic Ban
- • Primary ban: Gazette Notice No. 2356 (28 February 2017) under EMCA. Effective 28 August 2017. Bans the use, manufacture and import of all plastic carrier and flat bags. Survived constitutional challenge (Petitions 32 & 35 of 2017).
- • Penalties: EMCA Section 144 provides for KSh 2–4 million (~US$15,000–38,000) and/or 1–2 years imprisonment. The widely cited “4 years and $40,000” figure combines maxima across different EMCA offences — it is not the penalty for bag possession.
- • Protected areas extension: Gazette Notice No. 4858 (5 June 2019) bans all SUPs in national parks, reserves, beaches and forests from June 2020.
- • Organic waste bags: NEMA’s April 2024 notice outlawed plastic bags for organic waste collection, requiring 100% biodegradable garbage bags.
- • Sustainable Waste Management Act No. 31 of 2022 codifies circular economy principles.
- • Enforcing body: NEMA (National Environment Management Authority).
3.23.1.2 Which Plastic Items Are Banned in Kenya?
- • Banned nationwide: All plastic carrier bags and flat bags, regardless of thickness.
- • In protected areas: all SUPs including bottles, cups, cutlery, straws, plates.
- • Since April 2024: plastic bags for organic waste.
- • Not banned nationally: Plastic straws, cutlery, cups and plates remain legal outside protected areas.
- • Exemptions: Industrial packaging, medical use, export packaging (though manufacturers need NEMA permits).
3.23.1.3 Kenya’s Plastic Ban Timeline and Future Goals
- • EPR suspended: The EPR Regulations 2024 (Legal Notice No. 176) were gazetted 6 November 2024 but suspended by the Milimani High Court on 15 July 2025 following challenges over the KSh 150/consignment import fee. The EPR regime is in legal limbo as of April 2026.
- • Eco Levy gutted: The 2024 Finance Bill’s proposed KSh 150/kg levy on plastic packaging was stripped after the #RejectFinanceBill2024 protests. Only a levy on imported finished products survived.
- • UN Plastics Treaty: Kenya hosted INC-3 in Nairobi but joined the High Ambition Coalition only in late September 2024. Kenya is bidding to host the permanent Treaty Secretariat.
3.23.2 Kenya’s Plastic Ban Enforcement: Ground Reality
- • Strong initial impact, fading enforcement. NEMA reported 80%+ bag reduction in year one, with 500+ arrests and 300+ prosecutions. Actual fines ranged KSh 50,000–150,000 — far below statutory maxima.
- • Cross-border smuggling is endemic. Bags are known to pour in from Uganda, Tanzania, Ethiopia, Somalia, DRC and Burundi. Nairobi Governor Sakaja publicly acknowledged in May 2024 that bags “have come back.”
- • The protected-areas ban is weakly enforced outside flagship parks. Tour operators self-police but beach and market compliance is spotty.
3.23.3 Kenya’s Bioplastics Market Size and Manufacturers
- • Plastic packaging flow: ~260,000 tonnes/year (Eunomia/Danish EPA).
- • Recycling: ~37,000 tonnes.
- • Total plastic waste: 0.5–1.3 Mt/year, with over 92% mismanaged.
-
•
Domestic bioplastics production is pilot-scale:
- – HyaPak Ecotech (water hyacinth-based biodegradable materials)
- – Novamont Kenya (Cassabag — cassava-starch based)
- • No industrial-scale bioplastics manufacturing. Compostable resin is imported.
- • Standards in development: KEBS adopted ISO 17088 as interim. Draft standards DKS 3009:2024 and DKS 3013:2024 (home compostables) are being finalised.
3.23.4 Commentary and Insights
- • Kenya’s brand as the “world’s toughest plastic ban” is marketing, not market reality.
- • The ban covers only bags outside protected areas. Straws, cutlery and cups remain legal nationally.
- • Cross-border smuggling has eroded initial gains.
- • Enforcement has softened from prosecution to confiscation.
- • The suspended EPR is a major setback. Without functioning producer responsibility, there is no financial mechanism to fund collection, composting, or recycling infrastructure.
- • For bioplastics, the supply gap is enormous but the demand signal is weak. High mismanagement rates (92%+) and no composting infrastructure mean compostable alternatives have nowhere to go after use.
3.23.5 Kenya Opportunity Scorecard
| Factor | Score |
| Pillar 1: Regulatory Strength | 3.0 / 5 |
| 1A — Legal Framework Robustness | 3 |
| 1B — Ban Breadth (product categories) | 3 |
| 1C — Future Trajectory | 3 |
| Pillar 2: Enforcement Reality | 2 / 5 |
| Pillar 3: Market Opportunity Gap | 3 / 5 |
| Composite Score | 8.0 / 15 |
Verdict: Kenya’s reputation far exceeds its regulatory and enforcement reality. The bag ban is real but narrow, enforcement has weakened, EPR is judicially suspended, and composting infrastructure is absent. The opportunity gap is large (92% mismanagement) but cannot be captured with product supply alone.
3.24 ISRAEL – Single-Use Plastic Ban: Market Opportunity Index
Composite Score: 7.7 / 15 | Global Rank: #22
Home to TIPA and UBQ — two globally significant bioplastics innovators — but domestic regulation was weakened when the utensil tax was repealed in 2023 with no replacement.
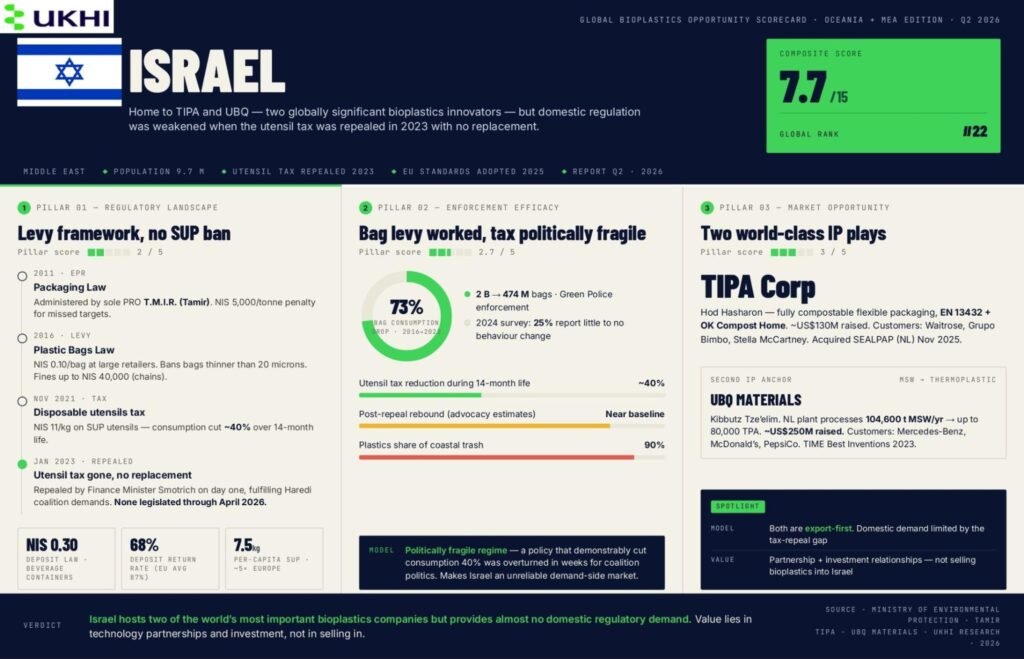
3.24.1 Israel’s Single-Use Plastic Ban: Laws and Regulations
3.24.1.1 Key Laws Governing Israel’s Plastic Ban
- • Plastic Bags Law (2016): Requires large retailers to charge NIS 0.10/bag. Bans bags thinner than 20 microns. Fines: up to NIS 20,000 per store, NIS 40,000 for chains. Enforced by the Ministry of Environmental Protection’s Green Police.
- • Disposable utensils tax (November 2021): NIS 11/kg on SUP utensils, NIS 3.3/kg on coated paper items. Repealed January–February 2023 by Finance Minister Smotrich on day one in office — fulfilling Haredi coalition demands. No replacement legislated through April 2026.
- • Packaging Law 2011: EPR administered by sole PRO T.M.I.R. (Tamir). Fine: NIS 5,000/tonne for missed targets.
- • Deposit Law: NIS 0.30 deposit on beverage containers. 68% return rate — below the EU average of 87%.
- • No comprehensive SUP ban exists. Israel adopted 40+ EU food-contact packaging standards from January 2025.
3.24.2 Israel’s Plastic Ban Enforcement
- • The bag levy worked. Consumption fell from ~2 billion bags (2016) to 474 million (2022) — a 73% reduction.
- • But a rebound effect is documented: a 2024 survey found 25% of Israelis reporting little to no change in behaviour.
- • The utensil tax cut consumption ~40% over its 14-month life but hit ultra-Orthodox families hardest (averaging 6 children, heavy Shabbat disposable use), fuelling political repeal.
- • Post-repeal rebound data is not published but advocacy groups report a return to pre-tax levels.
- • Per-capita SUP consumption: 7.5 kg/year — roughly 5× the European average. Plastics are 90% of Israel’s coastal trash.
3.24.3 Israel’s Bioplastics Market and Innovation
-
•
Israel has two globally significant bioplastics companies:
- – TIPA Corp (Hod Hasharon): Fully compostable flexible packaging, EN 13432 and OK Compost Home certified. ~US$130M raised including a US$70M Series C. Customers: Waitrose, Grupo Bimbo, Stella McCartney. Acquired Dutch firm SEALPAP in November 2025.
- – UBQ Materials (Kibbutz Tze’elim): Converts unsorted MSW into thermoplastic. Netherlands plant processes 104,600 t/year producing up to 80,000 TPA. ~US$250M raised. Customers: Mercedes-Benz, McDonald’s, PepsiCo. TIME Best Inventions 2023.
- • Both are export-first businesses. Domestic demand is limited by the regulatory gap left by the utensil tax repeal.
3.24.4 Commentary and Insights
- • Israel’s bioplastics value is in innovation and IP, not domestic demand. TIPA and UBQ are world-class companies selling globally but their home market provides almost no regulatory pull.
- • The utensil tax repeal is a cautionary tale. A policy that demonstrably cut consumption 40% was overturned in weeks for coalition politics. This makes Israel an unreliable regulatory environment for demand-side investment.
3.24.5 Israel Opportunity Scorecard
| Factor | Score |
| Pillar 1: Regulatory Strength | 2.0 / 5 |
| 1A — Legal Framework Robustness | 2 |
| 1B — Ban Breadth (product categories) | 2 |
| 1C — Future Trajectory | 2 |
| Pillar 2: Enforcement Reality | 2.7 / 5 |
| Pillar 3: Market Opportunity Gap | 3 / 5 |
| Composite Score | 7.7 / 15 |
Verdict: Israel hosts two of the world’s most important bioplastics companies (TIPA, UBQ) but provides almost no domestic regulatory demand. The utensil tax repeal demonstrates political fragility. Value lies in technology partnerships and investment relationships, not in selling bioplastics into Israel.
3.25 SAUDI ARABIA – Single-Use Plastic Ban: Market Opportunity Index
Composite Score: 6.3 / 15 | Global Rank: #25
The world’s largest petrochemical producer with no consumer SUP ban — an oxo-degradable mandate partially suspended and active opposition to global production caps.
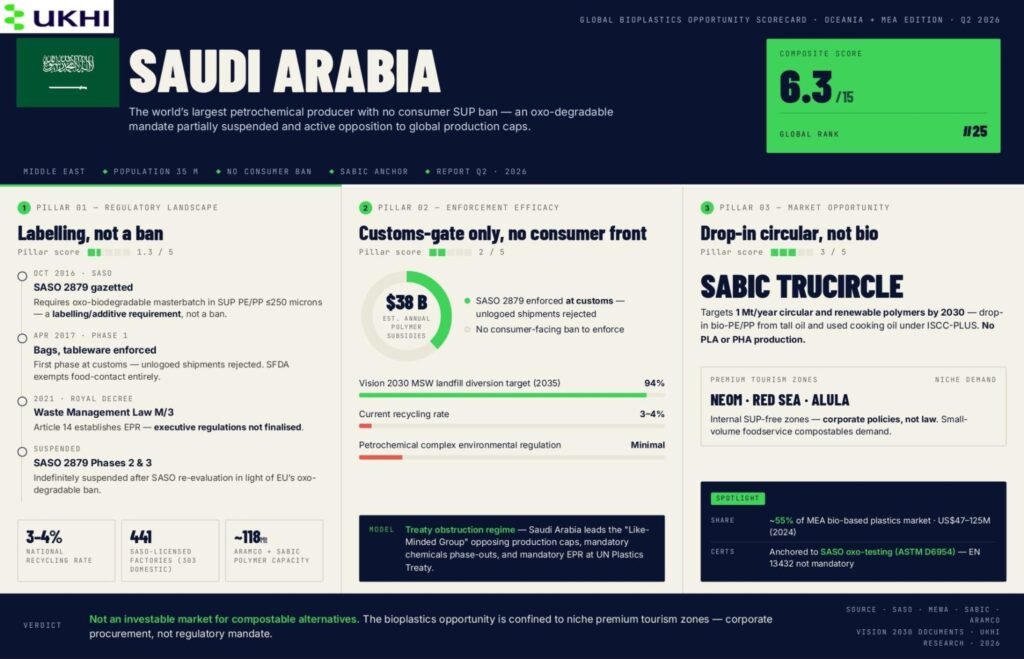
3.25.1 Saudi Arabia’s Single-Use Plastic Ban: Laws and Regulations
- • No nationwide consumer SUP ban exists. The signature instrument is SASO 2879 (October 2016), requiring oxo-biodegradable masterbatch in single-use PE/PP products ≤250 microns.
- • Phase 1 (bags, garbage bags, tablecloths, tableware) enforced since April 2017.
- • Phases 2 and 3 were suspended indefinitely after SASO re-evaluated in light of the EU’s oxo-degradable ban.
- • Waste Management Law (Royal Decree M/3 of 2021): Establishes EPR in Article 14 — but executive regulations are not finalised.
- • NEOM, Red Sea Global and AlUla operate internal SUP-free zones — these are corporate policies, not law.
- • Treaty position: Saudi Arabia leads the “Like-Minded Group” opposing production caps, mandatory chemicals phase-outs, and mandatory EPR at the UN Plastics Treaty. Estimated ~US$38 billion/year in polymer production subsidies.
- • SASO 2879 requires the oxo-biodegradable mark on five categories of products. This is a labelling/additive requirement, not a ban. SFDA exempts food-contact plastics entirely.
3.25.2 Saudi Arabia’s Plastic Ban Enforcement
- • SASO 2879 is enforced at customs — unlogo-ed shipments are rejected. 441 licensed factories (303 domestic). But there is no consumer-facing ban to enforce.
- • Vision 2030 targets 94% MSW landfill diversion by 2035 — backed by SR55 billion investment. The recycling rate is currently 3–4%.
- • The petrochemical complex is essentially unregulated for environmental impact. Aramco owns 70% of SABIC; combined capacity is ~118 Mt/year. Strategy is to grow production while investing in mechanical/advanced recycling.
3.25.3 Saudi Arabia’s Bioplastics Market and Manufacturers
- • Plastic waste: ~7 Mt/year. Recycling: 3–4%.
- • Bioplastics market: Ranges US$47–125M (2024) depending on source. Saudi Arabia holds ~55% of MEA bio-based plastics market share.
- • SABIC’s TRUCIRCLE targets 1 Mt/year circular and renewable polymers by 2030 — drop-in bio-PE/PP from tall oil and used cooking oil under ISCC-PLUS.
- • No PLA or PHA production. The regional PLA supplier will likely be Emirates Biotech (UAE). Certification anchored to SASO oxo-biodegradability testing (ASTM D6954). Compostability (EN 13432) is not mandatory.
3.25.4 Commentary and Insights
- • The opportunity is narrow: NEOM/Red Sea/AlUla premium tourism zones may create small-volume demand for compostable foodservice products, but this is corporate procurement, not regulatory mandate.
- • Saudi Arabia is not a primary bioplastics market unless specifically pursuing NEOM/Red Sea hospitality contracts. The regulatory, political and competitive (SABIC) barriers are too high.
3.25.5 Saudi Arabia Opportunity Scorecard
| Factor | Score |
| Pillar 1: Regulatory Strength | 1.3 / 5 |
| 1A — Legal Framework Robustness | 2 |
| 1B — Ban Breadth (product categories) | 1 |
| 1C — Future Trajectory | 1 |
| Pillar 2: Enforcement Reality | 2 / 5 |
| Pillar 3: Market Opportunity Gap | 3 / 5 |
| Composite Score | 6.3 / 15 |
Verdict: The world’s most powerful petrochemical producer with no consumer SUP ban, a partially suspended oxo-degradable mandate, and active opposition to global production caps. The bioplastics opportunity is confined to niche premium tourism zones. Not an investable market for compostable alternatives.
4. Implications for Bioplastics Companies and Investors
The country assessments in this report reveal a global market that is:
- • structurally fragmented,
- • politically unstable in places, and
- • full of asymmetric opportunities.
This chapter distils the strategic implications as a framework for deciding where to act, when to enter, and what to watch out for.
1. Volume Markets and Value Markets Are Not the Same Thing
The first decision any bioplastics company faces is whether to pursue scale or margin. This report’s data shows clearly that the two don’t overlap as much as you’d expect.
Volume opportunities — large demand, lower margins, enforcement risk:
- • India offers the world’s largest bioplastics opportunity by sheer scale, at 20+ million tonnes of annual plastic consumption, a comprehensive ban, and a near-empty bioplastics supply pipeline. But the market is split. The formal sector (organised retail, FMCG, e-commerce) complies and is growing fast. The informal economy (where a Toxics Link study found 64% of market sites still using banned plastics) remains largely untouched by regulation. Any India strategy must account for this dual market.
- • Indonesia and Brazil are similar: massive consumption, growing regulation, but enforcement gaps and informal-sector dominance that limit the addressable market in practice.
Value opportunities — smaller volumes, premium pricing, reliable demand:
- • Japan is not a volume play. There is no Japanese law banning any SUP item. But brand-owner partnerships (7-Eleven, Starbucks Japan, Lawson) and specialty demand for advanced materials like PHBH and bio-PC create a premium market driven by corporate sustainability commitments rather than regulation.
- • Australia combines high per-capita income, rigorous certification standards (AS 4736/5810), and a structural recycling shortfall which makes it a premium export market for certified compostable products.
Implication: Don’t chase the largest plastic consumption number. Chase the market where demand is enforceable, certifiable and payable.
2. Feedstock Position Determines Long-Term Competitiveness
Where a country sits on the feedstock curve matters more for long-term margins than any single regulation. Three production geographies stand out:
-
•
Thailand
- – cassava and sugar abundance
- – 8-year tax holidays for bioplastic projects
- – production costs of ~$1,200/tonne versus ~$2,100/tonne in Western markets
- – already hosts NatureWorks’ new 75,000 TPA PLA plant and TotalEnergies Corbion’s 75,000 TPA Luminy facility
- – ASEAN’s bioplastics production hub
-
•
Brazil
- – Braskem’s 275,000 TPA sugarcane bio-PE at Triunfo is the world’s largest bio-polyethylene operation
- – world-leading production, most of it exported, because there’s no federal ban driving domestic demand
-
•
UAE
- – Emirates Biotech’s 160,000 TPA PLA plant at KEZAD Abu Dhabi (targeting early 2028)
- – will be the world’s largest single-site PLA facility
- – an oil-producing nation building the world’s biggest bioplastics plant is the clearest signal of where capital sees long-term value
Implication: For companies without feedstock advantage, the strategic question is whether to produce where raw materials are cheap (Thailand, Brazil) or sell where regulation creates demand (Europe, Australia, India). These are rarely the same place.
3. Fiscal Forcing Is More Powerful Than Bans
A counterintuitive finding from this report: taxes and EPR fees are more reliable demand drivers than product bans. Bans depend on enforcement. Taxes work through the financial system, which makes them harder to evade and more consistent in effect.
The markets where fiscal pressure is highest on conventional plastic:
| Market | Combined regulatory cost burden |
| UK | ~£650/tonne (pEPR + Plastic Packaging Tax) |
| Spain | €0.45/kg (~€450/tonne) |
| Colombia | ~17% cost addition via IPUSUI tax |
| Denmark | ~€9.80/kg on carrier bags |
Implication: Look at cost pressure, not just bans.
4. Policy Reversal Is a Real and Underpriced Risk
- • Israel (utensil tax repeal)
- • South Korea (cup ban withdrawal)
- • Netherlands (enforcement pause)
- • Saudi Arabia (oxo rule suspension)
- • Kenya (EPR suspended)
- • USA (policy reversal)
These follow a clear pattern: regulation → cost → backlash → rollback.
The Italy case is critical. If its compostable exemption is removed under PPWR, a €704M market could shrink significantly.
Implication: Avoid dependency on a single regulation.
5. Three Forcing Events to Watch Through 2028
- • EU PPWR — August 2026 → creates single EU market
- • UAE PLA plant — 2028 → price + supply disruption
- • India EPR — 2028–29 → massive demand unlock
Implication: This is a wave-based market. Enter before demand peaks, not after.
Conclusion
Globally, the bioplastics opportunity mapped in this report is not theoretical. It is being created right now by specific laws, specific taxes, specific enforcement actions and specific industrial investments.
Some of these opportunities will grow. Others will reverse. The ones that endure will be in markets where regulation, enforcement and supply gap reinforce each other, and where companies position themselves before the regulatory wave arrives, not after.
This report will be updated annually as regulations evolve, enforcement data becomes available, and new markets enter the index.
For the latest data, country-specific guidance, or partnership enquiries, contact the Ukhi Research Division at info@ukhi.com.
© 2026 Ukhi Bioplastics Private Limited. All rights reserved.
References (countrywise)
Thailand
- Investigation of plastic waste management in Thailand using material flow analysis – nih.gov
- Plastic Waste Material Flow Analysis for Thailand – worldbank.org
- PLASTIC POLICIES IN THAILAND Country Profile – switch-asia.eu
- Thailand bans imports of plastic waste from January 1 – nationthailand.com
- Thailand Sets 2025 Target for Import Ban on Plastic Waste – sweap.eu
- NatureWorks Passes Final Authorization Milestone for New Fully Integrated Ingeo PLA Manufacturing Plant in Thailand – natureworksllc.com
- Thailand takes action on plastic – eastasiaforum.org
- Bio-Circular-Green Economic Model (BCG) – thaiembassy.org
- Thailand, Draft Sustainable Packaging Act – enviliance.com
Indonesia
- Indonesia’s 70% Marine Plastic Reduction Target: PERPRES 83/2018 – crpg.info
- PLASTIC POLICIES IN INDONESIA Country Profile – switch-asia.eu
- How Indonesia is combating marine plastic pollution from source to sea – worldbank.org
- EXTENDED PRODUCER RESPONSIBILITY GUIDELINE ON PLASTIC PRODUCTS AND PACKAGING – wwf.id
- What Waste Management Roadmap Exists Under PERMENLHK 75/2019? – crpg.info
- Jakarta to ban single-use plastic bags by June – thejakartapost.com
- The Single-Use Plastic Ban Regulation Has an Impact on Reducing the Generation of Plastic Waste in Bali – plasticdiet.id
- Seaweed over plastic: Indonesia’s race towards sustainable packaging – eco-business.com
- CJ BIO Inaugurates 5,000 Metric Ton Polyhydroxyalkanoate (PHA) Facility in Pasuruan, Indonesia – cjbiomaterials.com
- From Roots to Market: The Birth of Indonesia’s Bioplastic Industry – greenhope.co
China
- China unveils 5-year plan to control plastic pollution – gov.cn
- PLASTIC POLICIES IN CHINA Country Profile – switch-asia.eu
- China tightens controls on use of plastics – gov.cn
- China releases national standards for biodegradable plastic materials and products – enviliance.com
- Hainan leads in banning non-biodegradable plastic – chinadaily.com.cn
- China Aims to Go as Big in Bioplastics as It Did in Solar Panels – caixinglobal.com
- China Promulgates Amendment to Its Solid Waste Law – bdlaw.com
- Divergences and challenges in the negotiation of the global plastics treaty: China’s pathway – frontiersin.org
- Igniting a reuse revolution in China’s war against plastic waste – pacificenvironment.org
- China Cosmetics: Ban on Microbeads to Impact Sales & Production – chinalawinsight.com
South Korea (Republic of Korea)
- South Korea Partially Revises Recycling Resources Act – gpcgateway.com
- Korea to expand mandatory recycled plastic use in bottle manufacturing – koreaherald.com
- South Korea suspends plastic straw ban to ease small business’ economic burden – koreapro.org
- South Korea targets 30 per cent cut in plastic waste by 2030 – eco-business.com
- South Korea Bans Single-Use Hotel Amenities Effective March 29, 2024 – loyaltylobby.com
- The Recycling Illusion: Lessons from South Korea’s Plastic Problem – defendthemall.org
- 2050 Carbon Neutral Strategy of the Republic of Korea – unfccc.int
- SK Geo Centric, Kolon Industries commence biodegradable PBAT production in South Korea – indianchemicalnews.com
- Lotte to develop seawater-degradable bioplastic material – kedglobal.com
Japan
- Concerning the Act on Promotion of Resource Circulation for Plastics – gov-online.go.jp
- The Act on Promotion of Resource Circulation for Plastics – jwrf.or.jp
- Kaneka to boost PHBH production capacity in Japan – sustainableplastics.com
- Charging plastic bags: Perceptions from Japan – plos.org
- Japan’s Initiatives to Combat Plastic Pollution – spf.org
- Japan sets 2026 standards for eco-friendly plastic product certification – zenbird.media
- How Japan is using the circular economy to recycle plastics – circulareconomy.earth
- Mitsui Chemicals working on commercialisation bio-PP – bioplasticsmagazine.com
- Sea change: Japanese leads on marine plastic litter – eastasiaforum.org
India
- Ban on identified Single Use Plastic Items from 1st July 2022 – pib.gov.in
- Plastic Waste Management (Amendment) Rules, 2024 – drishtiias.com
- Understanding the Plastic Waste Management (Amendment) Rules, 2022 – investindia.gov.in
- Extended Producer Responsibility (EPR) for plastic waste – grantthornton.in
- How bad is India’s single-use plastic crisis? – downtoearth.org.in
- CPCB: Annual Report on Implementation of Plastic Waste – cpcb.nic.in
- How India Helped Scuttle the Global Plastics Treaty – thediplomat.com
- India among 12 nations responsible for 60% of mismanaged plastic waste – business-standard.com
- India Renews Environmental Compensation Fee under Plastic Waste Management Rules – enviliance.com
- India To Enforce New Barcode Regulations For Plastic Packaging From July – ssrana.in
Italy
- Decreto legislativo 8 novembre 2021, n. 196 – Recepimento direttiva SUP — Assolombarda – assolombarda.it
- Italy Transposes into National Law the EU Single-Use Plastic Products Directive – Lexology – lexology.com
- Italy Seeks PPWR Exemption for Compostable Packaging Rules – packagingworldinsights.com
- Biodegradable & Compostable | UNI EN 13432 & 14995 | Biorepack – biorepack.org
- Understanding the Plastic Tax in Italy: A Comprehensive Guide for July 2026 – hulkapps.com
- Italy Bioplastics Market: Opportunities for U.S. Companies – trade.gov
- The bioplastic market – Italy (11.2024) | Businesscoot – businesscoot.com
- Italy has already surpassed its 2030 targets for the recycling of compostable bioplastics | Biorepack – biorepack.org
- Italy’s Experience With Compostable Plastics In Organics Recycling | BioCycle – biocycle.net
- Italy: A Global Leader in Organic Waste Management – Compost Connect – compostconnect.org
- NOVAMONT INCREASES MATER-BI® PRODUCTION TO 150,000 TONNES – Novamont – novamont.com
- Italy becomes first EU country to ban plastic bags – PlasticsToday – plasticstoday.com
- PLASTICS IN ITALY A VICE OR A VIRTUE? TECHNICAL REPORT APRIL 2022 – eccoclimate.org
- Italy Enacts Plastic Bag Ban | NACS – convenience.org
- THE ITALIAN MARKET OF COMPOSTABLE BIODEGRADABLE BIOPLASTICS – assobioplastiche.org
Spain
- BOE-A-2022-5809 Ley 7/2022, de 8 de abril, de residuos y suelos contaminados para una economía circular – boe.es
- Plásticos de un solo uso – MITECO – miteco.gob.es
- BOE-A-2022-22690 Real Decreto 1055/2022, de 27 de diciembre, de envases y residuos de envases – boe.es
- COM4PHA: new biodegradable bioplastics for cosmetics, food and agricultural packaging – aimplas.net
- From waste to value: Transforming organic waste into biodegradable bioplastics | VEnvirotech – europa.eu
- Spain Plastic Packaging Tax Now in Effect – trade.gov
- Tax Agency: Excise tax on non-reusable plastic packaging – agenciatributaria.gob.es
- Information on Recycling for Household Packaging | Ecoembes – ecoembes.com
- Spain’s Ecoembes accused of falsifying plastic recycling rates – packaging-gateway.com
- Plastic waste in Spain – statistics & facts | Statista – statista.com
- Spain – European Environment Agency – europa.eu
- Spain: new tax measures in the Law on waste and contaminated land for a circular economy | Garrigues – garrigues.com
- Innovation and trends in bioplastics – AIMPLAS – aimplas.net
- Spain – European Bioplastics e.V. – european-bioplastics.org
- Spain to Ban Plastic Wrap for Fruits and Veggies – EcoWatch – ecowatch.com
France
- Directive (UE) 2019/904 du Parlement européen et du Conseil transposition – europa.eu
- AGEC law – What will change in the fight against waste – Pollutec – pollutec.com
- French Anti-Waste Law – Impact in Cosmetics Packaging and Labelling – CRITICAL CATALYST – criticalcatalyst.com
- Transition écologique : quelles obligations pour les cafés et restaurateurs ? – economie.gouv.fr
- 2023 : place à la vaisselle réutilisable dans les fast-foods ! | Zero Waste France – zerowastefrance.org
- Interdiction des emballages plastiques pour les fruits et légumes : le Conseil d’État annule le décret d’application – conseil-etat.fr
- France: Government Bans Single-Use Plastic Packaging for Various Perishable Products | Library of Congress – loc.gov
- Carbios Gets Green Light to Build a PET Bio-recycling Plant in France | Plastics Engineering – plasticsengineering.org
- CARBIOS celebrates groundbreaking of first plant – carbios.com
- Citeo – Contribution emballages : tarifs 2024 et nouveautés – naturaldevelopment.fr
- LOI n° 2021-1104 du 22 août 2021 portant lutte contre le dérèglement climatique – legifrance.gouv.fr
- Lactips creates edible plastic packaging from milk protein – dairyreporter.com
- Evaluation du taux de collecte des bouteilles en plastique de boisson pour 2022 et 2023 – ADEME – ademe.fr
- Décret n° 2021-461 du 16 avril 2021 relatif à la prévention des pertes de granulés de plastiques – legifrance.gouv.fr
- Roquette produit du bioplastique dans le Nord-Pas-de-Calais – usinenouvelle.com
United Kingdom
- The Environmental Protection (Plastic Plates etc. and Polystyrene Containers etc.) (England) Regulations 2023 – legislation.gov.uk
- Single-use plastics bans and restrictions – GOV.UK – gov.uk
- The Environmental Protection (Single-use Plastic Products) (Wales) Act 2023 – gov.wales
- Plastic Pollution Plan for Northern Ireland | DAERA – daera-ni.gov.uk
- The Environmental Protection (Single-use Plastic Products) (Scotland) Regulations 2021 – legislation.gov.uk
- Packaging Extended Producer Responsibility: Unboxing a new era – ERP UK – erp-recycling.org
- Extended Producer Responsibility for Packaging: 2025 base fees – GOV.UK – gov.uk
- Deposit return schemes – The House of Commons Library – parliament.uk
- Plastic Packaging Tax (PPT) statistics background and references – GOV.UK – gov.uk
- Floreon Durable Bioplastic Materials | Flame Retardant PLA – floreon.com
- Sustainable Packaging Solutions | Hydropol™ Technology | Aquapak – aquapakpolymers.com
- TIPA & Aquapak collaborate to meet industry demand for innovative circular packaging – aquapakpolymers.com
- The Environmental Protection (Plastic Straws, Cotton Buds and Stirrers) (England) Regulations 2020 – legislation.gov.uk
- Generation of plastic packaging waste in the UK 2012-2023 | Statista – statista.com
Germany
- Introduction of a ‘plastic tax’ (EWKFondsG) from 2024 – PKF Fasselt – pkf-fasselt.de
- ewkf | Umweltbundesamt – umweltbundesamt.de
- Referentenentwurf einer Verordnung über die Abgabesätze und das Punktesystem des Einwegkunststofffonds – BMUV – bmuv.de
- Einwegkunststofffondsgesetz » Das ändert sich ab 2024 – haendlerbund.de
- EUBP Reveals the results of the 2024 Market Data Report – European Bioplastics e.V. – european-bioplastics.org
- Ecoflex® (PBAT) – Plastics & Rubber – BASF – basf.com
- Level of packaging consumption in Germany remains very high | Umweltbundesamt – umweltbundesamt.de
- Deutscher Bundestag – Höhe der Abgabe für Lebensmittelbehälter und andere Plastikprodukte festgelegt – bundestag.de
- EWKVerbotsV – Verordnung über das Verbot des Inverkehrbringens von bestimmten Einwegkunststoffprodukten – gesetze-im-internet.de
- Einwegkunststoffverbotsverordnung (EWKVerbotsV) – Abfallmanager Medizin – abfallmanager-medizin.de
- Manufacturer of biodegradable + bio-based plastics – FKuR – fkur.com
- Startseite Zentrale Stelle Verpackungsregister (ZSVR) – verpackungsregister.org
- Lucid Verpackungsregister der ZSVR – lizenzero.de
- Europe’s Plastics Industry in 2023 | Plastics Engineering – plasticsengineering.org
- Article 5 of the PPWR: PFAS limit values and substance requirements for packaging – Noventiz – noventiz.de
Netherlands
- Staatsblad 2021, 294 | Overheid.nl > Officiële bekendmakingen – officielebekendmakingen.nl
- Besluit kunststofproducten voor eenmalig gebruik en wijziging BBV | Rijksoverheid.nl – rijksoverheid.nl
- Kunststofproducten voor eenmalig gebruik | Inspectie Leefomgeving en Transport (ILT) – ilent.nl
- Netherlands Introduces New Restrictions on Disposable Plastic Cups and Containers – packaginglaw.com
- Rules for plastic cups and containers (disposable plastic) | Business.gov.nl – https://business.gov.nl/
- Single-Use Plastics (SUP) Directive | Verpact – verpact.nl
- Avantium Successfully Starts Up First Part of its FDCA Flagship Plant – avantium.com
- TotalEnergies Corbion – Gorinchem, Netherlands – chemeurope.com
- Home – Paques biomaterials – paquesbiomaterials.nl
- Plans for new production plant to turn food residuals into PHA – Paques biomaterials – paquesbiomaterials.nl
- Knowns and unknowns of plastic waste flows in the Netherlands – PMC – nih.gov
- Plastic Soup Foundation – Plastic Plastic Facts & Figures – plasticsoupfoundation.org
- Regels voor wegwerpplastic blijven gelden, handhaving wordt tijdelijk aangepast | Afval Circulair – afvalcirculair.nl
- Rates for single-use plastic surcharge | Verpact – verpact.nl
Sweden
- Skatt på plastbärkassar avskaffas 1 november 2024 | Skatteverket – skatteverket.se
- Förordning (2021:996) om engångsprodukter | Sveriges riksdag – riksdagen.se
- Engångsplast och andere engångsprodukter – Naturvårdsverket – naturvardsverket.se
- GAIA BioMaterials | Sweden – gaiabiomaterials.com
- Compostable bioplastic Biodolomer by Gaia Biomaterials – cision.com
- Stora Enso and Sulapac bring the sustainable straw to the market – storaenso.com
- Perstorp steps up commitment to Caprolactone market for bioplastics – european-bioplastics.org
- Plastic in Sweden – from production to recycling – Naturvårdsverket – naturvardsverket.se
- Extended producer responsibility for packaging in Sweden – Naturvårdsverket – naturvardsverket.se
- Abolishing the plastic bag tax: what does it mean for you? – Avisera AB – avisera.se
- The Plastic Bag Tax is removed in Sweden – Tingstad.com – tingstad.com
- Sweden Packaging EPR Compliance: Registration & Reporting | ComplyMarket – complymarket.com
- Producer responsibility for packaging – NPA – npa.se
- EPR in Sweden for E-Commerce Sellers – Complete 2025 Guide | amavat.eu
- Sweden EPR Packaging Compliance | Registration, Reporting & Deadlines – regsurance.com
Denmark
- Single-use plastic – legislation – Dansk Producentansvar – producentansvar.dk
- Engangsplast – Miljøstyrelsen – mst.dk
- Extended Producer Responsibility for Packaging (EPR) – Denmark (EN) – ERP – erp-recycling.org
- Accounts and Indicators for Danish Plastic Flows – dst.dk
- Material flow and waste accounts – Statistics Denmark – dst.dk
- BioBag er verdens bedst sælgende komposterbare produkt | BioBag Denmark – biobagworld.com
- Environmental – Excise duties on goods (Plastic bag tax) | Business in Denmark – virk.dk
- Denmark puts tax on carrier bags – Euromeatnews.com – euromeatnews.com
- New Developments in the EPR Denmark, Eco-Modulation Explained – recyda.com
- Denmark Producer Responsibility for Packaging | EPR 2025 | Net Zero Compare – netzerocompare.com
- Extended producer responsibility for packaging in Denmark – Lizenzero Europe – lizenzero.eu
- EPR Denmark: Extended Producer Responsibility 2025 – ecosistant – ecosistant.eu
- Blog: New Danish EPR regulation on packaging: Navigating environmental regulations – KPMG – kpmg.com
- Extended producer responsibility for packaging | Get help from GS1 – gs1.dk
- Nyhed: Bekendtgørelse om engangsplastprodukter – nu i høring – Dakofa – dakofa.dk
Mexico
- Postura ante las modificaciones a la LGPGIR sobre plásticos de un solo uso – greenpeace.org
- Ley de Prevención y Gestión Integral de Residuos del Estado de Hidalgo – congreso-hidalgo.gob.mx
- Exigen al Senado la prohibición de plásticos de un solo uso – greentology.life
- Aprueba Senado retroceso en la regulación de plásticos de un solo uso – greenpeace.org
- Industria del plástico 2024 – guiaquimica.mx
- Nuevas reformas de la Ley para la Prevención y Gestión Integral de los Residuos en México – elempaque.com
- Basura Cero – Sedema – CDMX – https://www.sedema.cdmx.gob.mx/
- CDMX hacia la prohibición de plásticos de un solo uso – digipack.mx
- LEY DE RESIDUOS SOLIDOS DEL DISTRITO FEDERAL – paot.org.mx
- DECRETO DE REFORMA A LA LEY DE RESIDUOS SÓLIDOS DEL DISTRITO FEDERAL – basham.com.mx
- BIOFASE: The Solution from Avocado Seed – aim2flourish.com
- NMX-E-273-NYCE-2019 Industria del plástico – Plásticos compostables – economia.gob.mx
- Foro ANIPAC 2024 revela perspectivas de la industria del plástico – pt-mexico.com
- Mexico Bioplastics Market Size, Share & Growth Trends – stellarmr.com
- Bioplásticos a base de fibra de agave | BioSolutions – biosolutions.mx
- Ley General de Economía Circular: Guía Completa para Empresas en México – circularit.mx
- INVENTARIO NACIONAL DE FUENTES DE CONTAMINACIÓN PLÁSTICA – www.gob.mx
Brazil
- Projeto pretende acabar com plásticos descartáveis até 2029 — senado.leg.br
- PL 2524/2022 – Senado Federal – senado.leg.br
- “Projeto de Lei do Oceano Sem Plástico” tem sua 1ª vitória no Senado – oceana.org
- Panorama dos Resíduos Sólidos no Brasil 2024 – poder360.com.br
- Lei que proíbe canudos plásticos é regulamentada na cidade de São Paulo – fecomercio.com.br
- Decreto 10.936/2022 PNRS logística reversa – creditodelogisticareversa.com.br
- PERFIL 2023: INDÚSTRIA DO PLÁSTICO IMPULSIONA ECONOMIA BRASILEIRA – abiplast.org.br
- Cidade do Rio de Janeiro sanciona lei que proíbe canudos plásticos – oeco.org.br
- D12688 – Decreto 12.688/2025 logística reversa embalagens – planalto.gov.br
- Movimento Nacional dos Catadores de Materiais Recicláveis (MNCR) – mncr.org.br
- L14260 – Lei 14.260/2021 Incentivos à Reciclagem – planalto.gov.br
- I’m green bio-based – braskem.com.br/
- Braskem to invest US$61 million to increase biopolymer production – bioplasticsmagazine.com
- Suzano Begins Production of Sustainable Greenpack Paper – packnode.org
- Suzano Ventures invests $5m in Bioform Technologies’ bio-based plastics – packaging-gateway.com
- Brazil: Implications of the new plastics decree – bakermckenzie.com
- Products made of plastic falsely claimed to be biodegradable are on sale at Brazilian supermarkets – eurekalert.org
- Law No.12305 – Brazilian National Policy on Solid Waste – https://braziliannr.com/
- RECICLAGEM DE PLÁSTICOS NO BRASIL RECUPERA-SE EM 2024 – abiplast.org.br
- Abrelpe lança a nova edição do Panorama de Resíduos Sólidos no Brasil – portalsustentabilidade.com
Colombia
- Ley 2232 de 2022: Eliminación de productos plásticos de un solo uso en Colombia – telecafe.gov.co
- PLÁSTICOS POR LA VIDA – minambiente.gov.co/
- Ley 2232 del 2022 – Plástico de un solo uso en Colombia – plasticoscorrea.com
- RESOLUCION 803 DE 2024 – suin-juriscol.gov.co
- Impuestos a plásticos de un solo uso ¿acierto o desacierto? – uexternado.edu.co
- ABC Ley 2232 de 2022 – acoplasticos.org
- Resolución 1407 de 2018 – minambiente.gov.co
- Consumo de plásticos de un solo uso ha caído en 62% en Colombia: Acoplásticos – elcolombiano.com
- LifePack | Productos responsables con el Medio Ambiente – lifepack.com.co
- Colombia lidera en bioplásticos en Colombiaplast 2024 – grafix.com.co
- Conoce sobre los Bioplásticos: la alternativa ante la ley – esenttia.co
- Acoplásticos presenta balance del primer año de la Ley de Plásticos – acis.org.co
- Sentencia C – 194 de 2023 – https://www.corteconstitucional.gov.co/
- Mater-Bi® EF04P – Esenttia – esenttia.co
- Proyecto “Earth Pact”, papel y cartón de caña de azúcar – ekologypack.com.co
- GREENPACK S.A.S. – Proveedores – El Empaque – elempaque.com
- WWF se une al Pacto por los Plásticos en Colombia – wwf.org.co
- Colombia ante el desafío global del plástico – analdex.org
Canada
- Single-use Plastics Prohibition Regulations (SOR/2022-138) – justice.gc.ca
- Federal Court Rules that the Order Labelling Plastics as a Toxic Substance is Unreasonable – bennettjones.com
- Plan for the Ban: Federal Court of Appeal Upholds Order Underlying Canada’s Single-use Plastics Prohibition Regulations – mcmillan.ca
- Intergovernmental Negotiating Committee on Plastic Pollution (INC-4) – Ottawa – canada.ca
- Economic Study of the Canadian Plastic Industry – Summary Report – plasticactioncentre.ca
- Ontario Blue Box Program Operated Under Producer Responsibility Framework – RPRA – rpra.ca
- Québec sets launch date for phase 2 of deposit modernization – recyclingproductnews.com
- CleanBC Plastics Action Plan single-use 2023 regulation – gov.bc.ca
- Genecis Receives Funding from NGen to Scale Sustainable Bioplastic Production – globenewswire.com
- Plastic Bags Reduction Act CHAPTER 25 OF THE ACTS OF 2019 – nslegislature.ca
- About Us – Competitive Green Technologies – competitivegreentechnologies.com
- Federal Plastics Registry – Canada.ca – canada.ca
- Environment and Climate Change Canada 2024-25 Departmental plan – canada.ca
- 2026 FCA 17 – Federal Court of Appeal – fca-caf.ca
- Shopping bag and single-use plastic regulations across Canada – retailcouncil.org
- Canada Bioplastics Market Size & Share Analysis – mordorintelligence.com
- Pilot physical flow account for plastic material, 2019 – statcan.gc.ca
- Agricultural plastics in Canada and the globe – pubs.rsc.org/
- Solid waste diversion and disposal – canada.ca
- Environment and Climate Change Canada’s 2025-26 Departmental plan – canada.ca
USA
- Break Free From Plastic Pollution Act of 2023 | Congress.gov – congress.gov
- Fact Sheet: President Donald J. Trump Ends the Procurement and Forced Use of Paper Straws – whitehouse.gov
- SB 54: Plastic Pollution Prevention and Packaging Producer Responsibility Act – CalRecycle – ca.gov
- NatureWorks Announces Expanded Capacity at Blair Facility – bionebraska.org
- Plastic bag bans in the United States – Wikipedia – wikipedia.org
- US Backs Polluters Over People at UN Plastics Treaty Talks – plasticpollutioncoalition.org
- Bioplastics maker Danimer Scientific files for bankruptcy – plasticsnews.com
- Oregon Plastic Pollution and Recycling Modernization Act – oregon.gov
- Colorado HB 22-1355 Producer Responsibility Program For Recycling – colorado.gov
- Maine’s Implementation of Its Extended Producer Responsibility Law – printing.org
- Plastics: Material-Specific Data | US EPA – epa.gov
- Hawaii Act 254 single-use plastics foam polystyrene ban – hawaii.gov
- New York State Senate Bill 2025-S1464 – nysenate.gov
- Washington State Enacts EPR Program for Packaging – hklaw.com
- New Jersey Get Past Plastic Act – nj.gov
- Newlight Technologies: Converting Greenhouse Gas into Versatile Biomaterials – bio-sourced.com
- Attorney General Bonta Issues Reminder on EPS Foam Food Service Ware Ban – ca.gov
- President Trump and Administrator Zeldin Deliver Single Largest Deregulatory Action – epa.gov
- Plastic Waste Factsheet | Center for Sustainable Systems – umich.edu
- Maine Becomes First State to Sign Extended Producer Responsibility Law for Packaging – bdlaw.com
Australia
- Australia’s National Packaging Targets – APCO: https://apco.org.au
- Australia’s 2025 National Packaging Targets – QLM Group: https://qlmgroup.com
- APCO’s Strategic Roadmap for Achieving Australia’s 2025 Packaging Targets: https://packnode.org
- Everything You Need to Know About The Australian Packaging Covenant Organisation: https://specright.com
- Analysis report for 2025 National Packaging Targets released by APCO: https://wastemanagementreview.com.au
- Cutting down on single use plastics – the new Plastic Reduction and Circular Economy Act 2021: https://hunthunt.com.au
- NSW introduces law banning single-use plastics – Circular Australia: https://circularaustralia.com.au
- All links in a supply chain affected by NSW’s prod… | Clayton Utz: https://claytonutz.com
- Australia’s Progress on Single-Use Plastic Bans in the Second Half of 2024: https://chemlinked.com
- Which Australian states are banning single-use plastics? – AMCS: https://marineconservation.org.au
- Phasing Out Single Use Plastics – Plastic Ban Australia: https://retail.org.au
- Guide to the 2025 ban on single-use plastics: https://replacethewaste.sa.gov.au
- Australian Plastic Bans 2025: State-by-State Compliance Guide: https://www.circularblueprint.com/
- Australia to Phase Out Single-Use Plastic Bags, Straws & Utensils by 2025: https://globalcitizen.org
- Driving Change at the Global Plastics Treaty 2025: https://ausmap.org
Saudi Arabia
- New regulations for plastics in Saudi Arabia | S-GE: https://s-ge.com
- Saudi Arabia – Lorax EPI: https://loraxcompliance.com
- Imports of non-dissolvable plastic products prohibited; soon to be banned: https://arabnews.com
- Enforcement of SASO Technical Regulation for Degradable Plastic Products: https://intertek.com
- Mastering Packaging HS Codes in Saudi Arabia | Palm Horizon: https://palmhorizonksa.com
- Manufacturing Plastics In, or Exporting to, Saudi Arabia: https://symphonyenvironmental.com
- Waste Management Law – المركز الوطني لإدارة النفايات: https://mwan.gov.sa/
- Saudi Arabia introduces new waste management law | Enviliance ASIA: https://enviliance.com
- Saudi Arabia undertakes recycling and waste-to-energy projects: https://oxfordbusinessgroup.com
- SABIC – TRUCIRCLE™ Portfolio and Services: https://sabic.com
- Certified Renewable Polymers from TRUCIRCLE Portfolio: https://sabic.com
- Bio-Based Polyethylene Market Size, Share, Growth | Report 2034: https://marketresearchfuture.com
- National Center for Environmental Compliance: https://ncc.gov.sa
- Environmental Regulatory Framework: Saudi Arabia: https://theenvironmentconsultant.com
- Saudi Arabia Waste Plastic Recycling Market Size Report 2034: https://imarcgroup.com
Company Directory
Ukhi India Private Limited
Plot -141, IMT Main Rd, Industrial Area, Sector 68
Faridabad, Haryana 121004, India
Phone: +91-96259 68232
Email: info@ukhi.com
Website: www.ukhi.com
About the Authors
This report is a collective effort by the Ukhi Research Division, with support from our leadership team and technical experts.
Lead Author:
- Vishal Vivek
- Co-founder & CEO
- Email: vishal@ukhi.org
Contributors:
This work also benefited from contributions by Ukhi’s in-house research, commercial, and product teams.
For Further Inquiries
For questions, permissions, or requests related to this report or other Ukhi publications, please contact:
Research & Publications
Ukhi Bioplastics Private Limited
Email: info@ukhi.com
Phone: +91-96259 68232
Address: Plot -141, IMT Main Rd, Industrial Area, Sector 68, Faridabad, Haryana 121004, India
Website: www.ukhi.com
For media queries or speaking opportunities, please email Vishal Vivek (vishal@ukhi.com).
Note:
For the latest updates, product launches, or to connect with the authors, please visit www.ukhi.com or follow us on LinkedIn and other social media channels.