Prepared by
Ukhi Research Division
Ukhi Bioplastics Private Limited
India
Report Highlights
This report covers the global sustainable packaging materials market across five material categories: paper and cardboard, bioplastics, recycled plastics, molded fiber and pulp, and emerging next-generation materials. Before reading, five things are worth knowing about what this report contains and how it is put together.
-
Market size data is presented as a range
For every material category, market size estimates from multiple research firms are compared side by side. Where estimates diverge significantly, the report explains why, including what definitional differences are driving the gap. Readers who have encountered conflicting market size figures elsewhere will find those conflicts addressed directly.
-
Every major geography is covered
Each chapter includes regional breakdowns for Asia-Pacific, Europe, North America, and Latin America.
-
The regulatory landscape is mapped concretely, with specific deadlines
Rather than describing regulation in general terms, the report identifies specific rules, the dates they apply, the formats they affect, and the markets they cover. This includes the EU PPWR, India’s Plastic Waste Management Rules, US state-level EPS bans, and the UK Plastic Packaging Tax.
-
Cost premiums are stated
The report does not present sustainable materials as cost-neutral alternatives. Where materials carry a significant price premium over conventional equivalents, that premium is stated with the source data behind it and the conditions under which it narrows.
-
The final chapter is structured for direct use by investors and procurement teams
The strategic chapter does not summarise the report. It draws out the investment thesis, identifies where capital is concentrated and where gaps exist, provides a practical material-switching framework, and maps the regulatory deadlines that require decisions now rather than later.
Publication Details
- Publication Date: May 2026
- Publisher: Ukhi Bioplastics Private Limited
- Location: New Delhi, India
- Report Period Covered: Regulatory and market data current as of Q1 2026
- Data Last Updated: 5th May, 2026
Disclaimer
- This report was produced by Ukhi, a bioplastics company based in India with a commercial interest in one of the five material categories covered. While every effort has been made to ensure consistent and impartial treatment across all categories, readers should be aware of this relationship when interpreting the analysis.
- The market size figures, growth forecasts, and CAGR projections presented throughout this report are drawn from third-party market research publications, industry association data, company disclosures, and publicly available sources. Ukhi has not independently verified these figures. Where estimates vary between sources, the range is presented and the reasons for variation are explained, but no warranty is made as to the accuracy, completeness, or reliability of any third-party data reproduced here.
- All forward-looking statements, including market forecasts, cost parity timelines, and regulatory implementation schedules, are projections based on information available at the time of publication. Actual outcomes may differ materially from those projected. Market conditions, regulatory developments, and technology trajectories can change in ways that are not reflected in the data presented here.
- Nothing in this report constitutes investment advice, financial advice, or a recommendation to buy, sell, or hold any security or asset. Investors should conduct their own due diligence and seek independent professional advice before making any investment decision based on information contained in this report.
- Nothing in this report constitutes legal or regulatory compliance advice. Regulatory information is presented for informational purposes only. The regulatory landscape for packaging materials is evolving rapidly, and specific rules, deadlines, and requirements should be verified against official sources and reviewed by qualified legal counsel before being relied upon for compliance purposes.
- The report was finalised in May, 2026. Regulatory status, company funding positions, market data, and technology readiness assessments reflect information available at that date and may have changed since publication.
- The mention of specific companies, products, certifications, or technologies in this report does not constitute an endorsement by Ukhi of those companies, products, certifications, or technologies, nor does it imply any commercial relationship unless explicitly stated.
Executive Summary
The global sustainable packaging market is one of the most consequential industrial transitions of the current decade. Driven primarily by regulation rather than consumer choice, it is reshaping supply chains across food and beverage, electronics, personal care, pharmaceuticals, and e-commerce simultaneously.
This report covers five material categories that together constitute the core of the sustainable packaging materials market: paper and cardboard, bioplastics, recycled plastics, molded fiber and pulp, and emerging next-generation materials.
Across these five categories, the total addressable market exceeded USD 500 billion in 2025, with the paper and cardboard segment alone accounting for USD 410 to 480 billion.
The remaining four categories range from early-commercial to fully scaled, with individual market sizes from USD 85 million (mycelium packaging) to USD 14 to 20 billion (bioplastics), depending on scope and definition.
The structural driver for this market is regulatory.
- The EU Packaging and Packaging Waste Regulation applying from August 2026
- India’s Plastic Waste Management Rules mandating rising recycled content thresholds to 60% by 2028-29
- 12 US state EPS bans already in force
- The UK Plastic Packaging Tax
Together, these regulations are removing legal alternatives for buyers.
For investors and procurement teams, this means the relevant question is whether supply of sustainable packaging can scale to meet it on the regulatory timeline.
Key Findings
Across every material category in this report, the primary demand signal is a legal mandate or financial penalty on conventional alternatives, not organic consumer pull.
The EU SUP Directive banning EPS food containers, India’s single-use plastic ban covering 19 item categories, and EPR recycled content thresholds all create compliance demand that is structurally different from discretionary purchasing.
Revenue tied to regulatory mandates is more durable than revenue tied to consumer sentiment, but it is also binary: if supply cannot meet mandated demand on the regulatory schedule, the market does not clear smoothly.
With a global market of USD 410 to 480 billion in 2025 and a 4.6 to 5.0% CAGR, paper and cardboard is by far the largest sustainable packaging category. But the carbon case for paper is application-dependent.
Peer-reviewed lifecycle analysis finds that even traditional plastics have lower greenhouse gas emissions than paper in 13 of 14 packaging applications studied.
Paper wins on end-of-life metrics, recyclability infrastructure, and consumer perception. Brands switching to paper primarily for carbon credentials without functional-unit LCA data are taking a position the evidence does not always support.
The global bioplastics packaging market reached USD 8 to 14 billion in 2024 and is growing at 14 to 17% CAGR.
Within the category, PHA is the only mainstream bioplastic that is both bio-based and home compostable, and in some formulations marine biodegradable.
PLA is industrially compostable but does not biodegrade in home compost or soil. Bio-PE and bio-PET are bio-based but not biodegradable at all.
The common conflation of these sub-categories in sustainability claims creates significant greenwashing exposure for brands that do not distinguish between them.
rPET commanded a 70 to 80% premium over virgin PET in mid-2025 despite years of regulatory-driven demand growth. Food-grade rHDPE runs 200 to 300% above virgin in the US.
Chemical recycling, widely expected to close the supply gap, has had a difficult 2024 to 2025:
- Brightmark filed for bankruptcy,
- Dow cancelled its flagship Böhlen plant, and
- Neste cancelled its Vlissingen project.
Eastman’s Kingsport facility is the clearest commercial success, and it works because of long-term offtake contracts, not technology alone.
Mechanical recycling will remain the primary workhorse for recycled plastics through at least 2030.
The global molded fiber packaging market is USD 5.5 to 6.2 billion in 2025 on the narrow definition, growing at 5 to 7.5% CAGR.
Electronics brands including Apple, Samsung, and Amazon have made durable, supply-chain-level commitments to molded fiber.
The PFAS-in-food-service issue is the category’s most significant near-term risk: testing has found fluorine in roughly two-thirds of sampled fiber food containers.
Producers that complete the transition to certified PFAS-free barrier chemistry before the EU PPWR’s August 2026 deadline will hold a meaningful compliance advantage.
The window between August 2026 and 2030 will determine which sustainable packaging formats become standard supply and which remain niche.
The PPWR recyclability deadline, India’s 60% PCR mandate, the first post-PFAS regulatory cycle, and cost-parity arrival for mycelium and bagasse composites will all resolve in this period.
Procurement teams that map their current packaging formats against these deadlines now, and investors that distinguish between regulatory-mandate revenue and consumer-preference revenue, will be in a structurally stronger position than those treating these as distant sustainability questions.
About This Report
This is a comprehensive market sizing and analysis report covering the global sustainable packaging materials landscape.
It covers five material categories: paper and cardboard packaging, bioplastics, recycled plastics, molded fiber and pulp, and emerging next-generation packaging materials.
Each chapter addresses market size, growth trajectory, geographic distribution, key applications, and the drivers and challenges shaping each category.
This report is intended for four audiences:
- procurement and packaging decision-makers at brands evaluating material options;
- investors and analysts assessing the sustainable packaging space;
- sustainability and ESG professionals tracking regulatory and market developments; and
- industry participants mapping the competitive landscape.
Each chapter is structured to be useful to all four, with the strategic chapter at the end addressing investors and procurement teams directly.
Scope and Boundaries
What this report covers
The report analyses five material families within the sustainable packaging market:
- Paper and cardboard packaging — corrugated board, folding cartons, kraft paper, liquid paperboard, and paper-based flexible packaging
- Bioplastics packaging — PLA, PHA, PBAT, starch blends, and bio-based drop-in plastics (bio-PE, bio-PET)
- Recycled plastics packaging — mechanically and chemically recycled rPET, rHDPE, rPP, and other post-consumer resin (PCR) streams
- Molded fiber and pulp packaging — wet-formed and dry-formed products from wood pulp, sugarcane bagasse, bamboo, wheat straw, and other agricultural fiber feedstocks
- Emerging and next-generation materials — mycelium composites, seaweed and algae-based materials, nanocellulose films, protein-based films, chitosan, and agri-waste structural composites
The report covers global markets with specific geographic breakdowns for Asia-Pacific, Europe, North America, and Latin America.
The forecast horizon is 2026 to 2035. Market sizing figures use 2024 or 2025 as the base year, depending on the most recent data available for each category. All monetary figures are in US dollars unless explicitly noted. India-specific figures are sometimes presented in Indian rupees (INR) where the source data is in that currency.
What this report does not cover in depth
- Glass and metal packaging are not covered. Both are mature, highly recyclable categories with established infrastructure, and neither is experiencing the regulatory disruption or rapid material innovation that characterises the five categories above.
- Reusable packaging systems are addressed as a concept within the three-axis framework in Chapter 2 but are not analysed as a standalone market. Reuse is a system model, not a material — it can apply to glass, plastic, metal, or fiber. A separate analysis of the refill and reuse economy would require different framing and data sources.
- The report does not address active and intelligent packaging (sensors, freshness indicators, RFID) except where these technologies intersect with emerging bio-based materials.
- Packaging machinery, equipment, and services are outside scope.
Methodology
How we handle market size estimates
The most significant methodological challenge in writing a market sizing report for sustainable packaging is that the numbers disagree.
The molded fiber packaging market is cited at USD 5.5 billion by IMARC Group and at USD 14.84 billion by Mordor Intelligence for approximately the same year.
The bioplastics market ranges from under USD 10 billion to over USD 20 billion depending on the research firm.
These are not data quality failures; instead they reflect genuine differences:
- whether the “market” being measured is production capacity, sales value, or end-product value;
- whether the scope is global or regional;
- whether adjacent materials are included or excluded; and
- what counting methodology is applied to multi-material packaging structures.
Our approach throughout this report is to present the range rather than arbitrarily select a single figure. Where consensus exists across multiple research firms, we note it. Where the spread is wide, we explain what is driving the difference.
For each material category, a comparison table of estimates across research firms is included so readers can see the dispersion and understand which definitions produce which numbers.
We do not endorse any single research firm’s methodology. We treat market research reports as useful triangulation tools, not as ground truth.
The most reliable estimates in any given category are those that have convergent outputs across multiple independent firms, that cite their scope definitions clearly, and that are consistent with company-level revenue data and production statistics where those are available.
How we use the three-axis framework
The report organises all sustainable packaging analysis using a three-axis framework established in Chapter 2.
The three dimensions are material (what the package is physically made of), end-of-life property (what happens to it after use), and system or business model (how the packaging flows through the economy).
This framework is not unique to Ukhi, but it is not consistently applied in most industry analysis, which routinely conflates the three dimensions.
- “Compostable packaging” is incorrectly treated as a peer category of “bioplastics” in many market reports, when compostability is actually an end-of-life property that some bioplastics have and others do not.
- “Reusable packaging” is treated as a material category when it is a system model.
These conflations produce analytical errors that show up as misleading comparisons, double-counting, and incoherent market sizing.
Currency, base years, and data recency
- All global market sizes are reported in US dollars.
- Where data is available for both 2024 and 2025, the more recent figure is used.
- CAGR figures are drawn from the research firm source cited and cover the period stated in that source, which varies between firms.
- Readers comparing CAGRs across categories should check the base and end years, as a CAGR covering 2022 to 2030 is not directly comparable to one covering 2025 to 2033 even if the percentage appears similar.
- Company-level data is sourced from company disclosures, stock exchange filings, and verified press releases wherever possible.
1. Understanding Sustainable Packaging
1.1 What Is Sustainable Packaging?
Sustainable packaging is an umbrella term that covers any packaging designed, sourced, manufactured, and managed to reduce its environmental impact across its entire life cycle, right from raw material extraction through to disposal or recovery.
The most widely referenced definition of sustainable packaging comes from the Sustainable Packaging Coalition (SPC), an industry body hosted by GreenBlue.
Sustainable Packaging Definition — Sustainable Packaging Coalition (SPC)
SPC defines sustainable packaging through eight criteria that a package should work toward simultaneously.
These are:
- It is beneficial, safe, and healthy for individuals and communities throughout its life cycle.
- It meets market criteria for both performance and cost.
- It is sourced, manufactured, transported, and recycled using renewable energy.
- It optimises the use of renewable or recycled source materials.
- It is manufactured using clean production technologies and best practices.
- It is made from materials that remain healthy in all probable end-of-life scenarios.
- It is physically designed to optimise materials and energy.
- It is effectively recovered and utilised in biological and/or industrial closed-loop cycles.
The SPC frames this as a direction of travel, not a destination. No package is “sustainable” in absolute terms. It can only be more or less sustainable than the alternatives.
Sustainable Packaging Definition — Ellen MacArthur Foundation (EMF)
The Ellen MacArthur Foundation (EMF) takes a different but complementary approach.
Rather than defining sustainable packaging directly, EMF frames packaging within the circular economy, which is a system built on three principles:
- eliminate waste and pollution,
- keep products and materials in use at their highest value,
- and regenerate natural systems.
EMF’s New Plastics Economy Global Commitment, now signed by over 1,000 organisations, sets a concrete target: all plastic packaging should be reusable, recyclable, or compostable, and actually reused, recycled, or composted in practice.
Ukhi Definition — Sustainable Packaging:
Packaging that is designed and managed to minimize environmental impact across its full life cycle, through responsible sourcing, efficient use of materials, and effective recovery after use.
A common source of confusion is the relationship between sustainable packaging, green packaging, and eco-friendly packaging.
In practice, these terms are often used interchangeably in marketing, but they carry different levels of rigour.
- “Sustainable packaging” implies a life-cycle perspective.
- “Green packaging” and “eco-friendly packaging” are vague, and regulators have taken notice of this.
The U.S. Federal Trade Commission’s Green Guides explicitly warn that broad, unqualified claims like “green” or “eco-friendly” are difficult if not impossible to substantiate and should not be used without clear qualification.
The EU’s Green Claims Directive (in force from 2026) goes further, requiring that any environmental claim made about a product (including packaging) be backed by a recognised scientific methodology and independently verified before it can appear on a label.
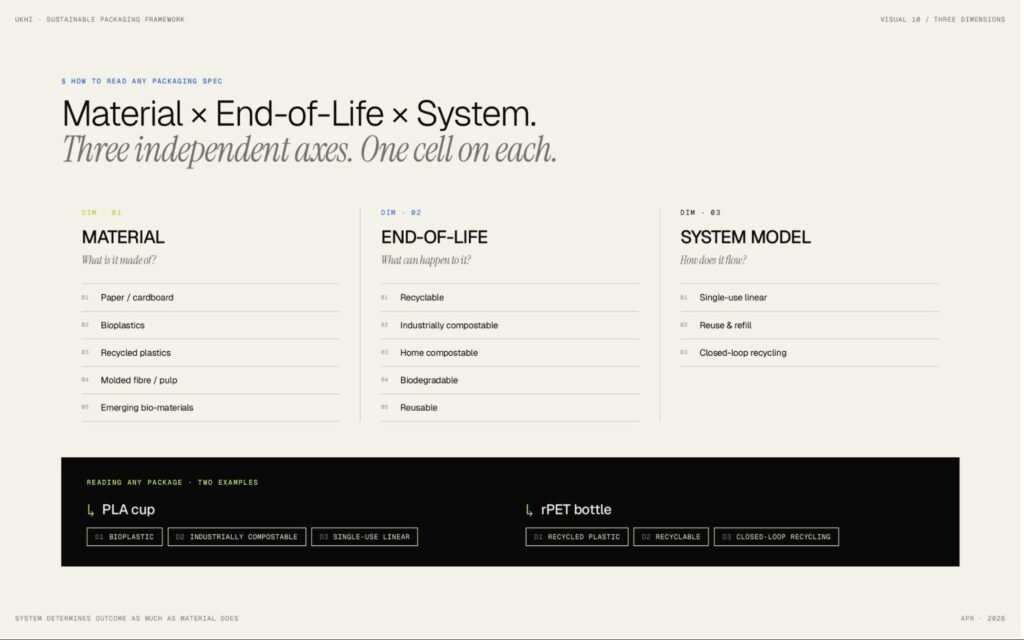
1.2 The Three Dimensions of Sustainable Packaging
To understand what sustainable packaging actually entails, it helps to think of it along three independent dimensions.
Each dimension describes a different aspect of a package — what it is made of, what can happen to it after use, and how it moves through the economy.
Dimension 1: Material — What Is the Packaging Made Of?
This is the most concrete dimension of sustainable packaging, as it asks a physical question: what substance is this package made from?
There are five major material categories across sustainable packaging:
- Paper and cardboard — Renewable, fiber-based materials including corrugated board, folding cartons, kraft paper, and paperboard. These are the most established sustainable packaging materials by market size.
-
Bioplastics — Plastics that are either bio-based (which means they are derived from biological feedstocks like corn, sugarcane, or cellulose), biodegradable (not the same as bio-based), or both.
Major types of bioplastics include PLA (polylactic acid), PHA (polyhydroxyalkanoates), PBAT, starch blends, and bio-based “drop-in” plastics like bio-PE and bio-PET.
-
Recycled plastics — Conventional plastic resins (PET, HDPE, PP) that incorporate post-consumer recycled (PCR) content.
Key forms include rPET (recycled PET), rHDPE, and output from chemical recycling processes.
-
Molded fiber and pulp — Packaging formed from wet or dry pulp using agricultural residues such as bagasse (sugarcane fiber), wheat straw, bamboo, or recycled paper pulp.
Common products include clamshells, trays, and protective packaging inserts.
-
Emerging bio-materials — Next-generation materials at early commercial or pre-commercial stages.
These include mycelium composites (grown from fungal root networks), seaweed-based films, agricultural waste composites, and edible coatings.
Key Insight:
Not all bioplastics are biodegradable, and not all biodegradable plastics are bio-based.
For example:
- Bio-PE (bio-based polyethylene) is made from sugarcane but behaves identically to fossil-based PE. It is recyclable, not biodegradable.
- PBAT is fossil-based but is biodegradable and industrially compostable.
So, in bioplastics, the feedstock origin and the end-of-life behavior are independent properties.
Dimension 2: End-of-Life Property — What Happens To A Package After Use?
This dimension describes what can happen to packaging once the consumer is finished with it. Although it is a property of a material and the design of the packaging, it is not a category parallel to materials.
The key end-of-life pathways for packaging are:
- Recyclable — This means a package can be collected, sorted, and reprocessed into new material. Recyclability is not just a material trait. It depends on three things working together:
- the design of the packaging (no problematic additives or multi-material layers),
- collection access (the U.S. FTC Green Guides state that for a company to make an unqualified “recyclable” claim on its packaging, at least 60% of the population where the product is sold must have access to facilities that actually collect and process that material),
- and the existence of end markets willing to buy the recovered material for remanufacturing.
- Industrially compostable — The package breaks down in a controlled commercial composting facility at temperatures of 55–75°C. The compostability of a packaging material is governed by two main standards:
EN 13432 (Europe) requires that:
- at least 90% of the material biodegrades into CO₂ within 180 days under controlled composting conditions,
- 90% of the material disintegrates into fragments smaller than 2mm within 12 weeks, and the resulting compost shows no eco-toxicity (tested via plant growth assays), and
- heavy metal concentrations remain below specified limits.
ASTM D6400 (North America) sets substantially similar requirements:
- 90% biodegradation within 180 days, 90% disintegration, and eco-toxicity and heavy metal limits.
- Home compostable — The package breaks down at ambient temperatures (20–30°C) in a garden compost bin, typically within 12 months. There is no globally harmonized standard for home-compostability as of 2026. The main references are:
- Australia’s AS 5810
- France’s NF T 51-800
- TÜV Austria’s OK compost HOME scheme
Note: PLA, despite being widely marketed as compostable, generally requires industrial temperatures and does not home compost.
- Biodegradable — The material will eventually break down through natural biological processes. However, “biodegradable” does not specify the timeframe or the conditions required.
For context, wood is biodegradable, but a wooden structure can last centuries. This is why regulators treat the term with caution: the U.S. FTC Green Guides state that a company can only make an unqualified “biodegradable” claim if the product will completely decompose within one year after customary disposal.
Since most packaging ends up in landfill (where decomposition conditions are anaerobic and slow), very few products can legitimately meet this standard. Without specifying the environment, temperature, and timeframe, calling a package “biodegradable” communicates almost nothing useful to the buyer.
- Reusable — The package is designed and supported by a system for multiple use cycles.
Under ISO 18603, a package only qualifies as reusable if three conditions are met:
- it has a designed minimum number of trips or rotations it can withstand,
- there is an operating system for collecting and reconditioning it after each use, and
- there is a control mechanism to track and manage the process.
This means that simply repurposing a jar as a pencil holder, or using a sturdy bag a few extra times before discarding it, does not qualify as reuse in any regulatory or standards-based sense. The system has to exist, not just the intention.
‘Biodegradable’ vs ‘Compostable’:
All compostable materials are biodegradable, but not all biodegradable materials are compostable. The difference is rigour.
- break down within a defined timeframe (180 days for industrial composting),
- at a defined temperature range (55–75°C),
- into fragments smaller than 2mm within 12 weeks,
- leave behind no toxic residue (verified through plant growth tests), and
- pass independent third-party certification.
“Biodegradable,” by contrast, simply means the material will break down at some point, under some conditions, over some undefined period.
A product labelled “biodegradable” with no further qualification gives a procurement team or a consumer no actionable information about what will actually happen to that package after disposal.
Dimension 3: System Model — How Does the Packaging Flow Through the Economy?
This dimension is about the business and logistics model that governs a packaging type, not the materials it is made of, or their chemistry thereof.
Three system models exist:
- Single-use linear — The package is used once and disposed of. This is still the default for the vast majority of packaging worldwide. The environmental outcome depends entirely on what happens at disposal — recycling, composting, landfill, or leakage into the environment.
- Reuse and refill — The package is returned, cleaned, and refilled for another use cycle.
The Ellen MacArthur Foundation identifies four reuse models:
- refill at home (concentrated cleaning products, subscription milk),
- refill on the go (in-store bulk dispensers),
- return from home (collected at the doorstep), and
- return on the go (deposit return schemes, reusable cup systems).
Reuse applies across materials; glass bottles, steel containers, durable plastic crates, and even paper-based systems can all be designed for reuse.
- Closed-loop recycling — The material is recovered and reprocessed into the same application it came from.
Bottle-to-bottle rPET is the canonical example. This is distinct from “downcycling,” where recovered material goes into a lower-value application (PET bottles becoming polyester fiber, for instance), which is a path that delays but does not prevent the material from becoming waste.
The critical point is that system model is independent of material.
A glass bottle in a deposit return scheme is reusable. The same glass bottle sold with no return infrastructure is single-use linear.
A PLA cup in a city with industrial composting infrastructure has a viable circular pathway. The same PLA cup in a city without that infrastructure ends up in landfill, where it will not compost.
So, the system determines the outcome as much as the material does.
Why These Dimensions Get Conflated — and Why It Matters
- Bioplastic ≠ biodegradable.
- Biodegradable ≠ compostable.
- Recyclable ≠ recycled.
- Reusable ≠ durable.
Any single package sits in one cell on each of the three dimensions simultaneously.
A PLA cup is (Material: bioplastic) × (End-of-life: industrially compostable) × (System: single-use linear, routed to industrial composting).
A rPET bottle is (Material: recycled plastic) × (End-of-life: recyclable) × (System: closed-loop recycling).
Reading packaging through this three-dimensional lens prevents the category errors that otherwise dominate sustainability reporting.
For the rest of this report, we use material as the primary organising dimension. Each subsequent chapter analyses one material category in depth.
This keeps the analysis grounded in the physical and commercial reality of what packaging is made from, while recognising that material choice alone does not determine sustainability, and the infrastructure, regulation, and systems around it matter just as much.
2. Global Sustainable Packaging Market — Size, Growth & Outlook
2.1 Global Sustainable Packaging Market Size
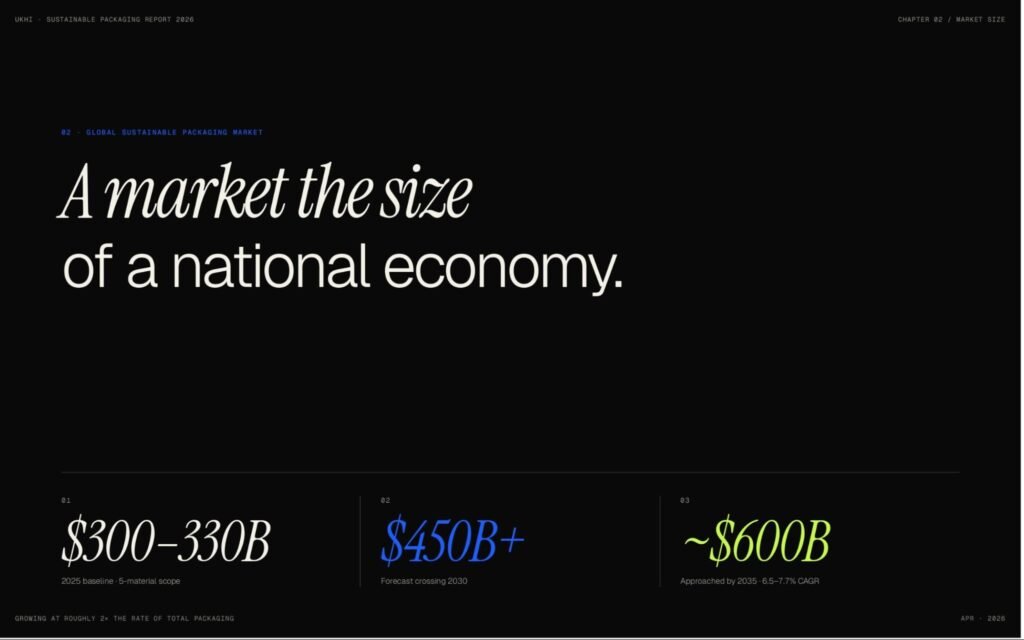
The global sustainable packaging market size was in a band of USD 280–330 billion as of 2025, based on estimates from more than a dozen independent research firms.
This makes sustainable packaging one of the largest and fastest-growing segments within the broader global packaging industry, which Smithers valued at USD 1.23 trillion in 2024.
The range of estimates is wide, from USD 127 billion (Precedence Research) at the low end to USD 498 billion (Market Research Future) at the high end.
This roughly four-fold spread is almost entirely an artefact of scope, as firms that include all paper and cardboard packaging, recycled-content conventional plastics, glass, and metal arrive at higher figures.
Firms that count only the “substituted sustainable share” (packaging that actively replaces a conventional alternative) arrive at lower figures.
Neither approach is wrong; but they are answering different questions about what “sustainable” includes.
For this report, the scope covers five material categories:
- paper and cardboard,
- bioplastics,
- recycled plastics,
- molded fiber, and
- emerging bio-materials.
We exclude recycled glass and recycled metal.
On this basis, the global sustainable packaging market size for 2025 is USD 300–330 billion.
Sustainable Packaging Market Size Estimates by Research Firm
| Research Firm | Market Size Estimate | Forecast | CAGR |
|---|---|---|---|
| Mordor Intelligence (Jan 2026) | USD 303.8B (2025) | USD 463.4B by 2031 | 7.29% |
| Grand View Research | USD 289.0B (2024) | USD 448.5B by 2030 | 7.6% |
| Straits Research | USD 283.4B (2024) | USD 552.5B by 2033 | 7.7% |
| Towards Packaging | USD 313.7B (2025) | USD 594.5B by 2035 | 6.6% |
| Persistence Market Research | USD 280.3B (2025) | USD 493.0B by 2032 | 8.4% |
| Fortune Business Insights | USD 374.9B (2025) | USD 552.45B by 2033 | 6.70% |
| BCC Research | USD 278.1B (2023) | USD 391.1B by 2029 | 6.0% |
Note: Fortune Business Insights uses a broader scope that includes glass and metal packaging. BCC Research uses a conservative scope and an earlier base year.
Insight — Why Market Size Estimates Vary So Widely:
The single biggest variable is whether all paper packaging gets counted as “sustainable.”
This one decision swings the global sustainable packaging market size by USD 150–200 billion.
The second largest variable is whether recycled-content conventional plastic (a PET bottle with 30% rPET, for example) counts as fully sustainable or only the recycled portion counts.
Readers comparing estimates across firms should always check the scope definition before drawing conclusions.
Historical Growth
Working back from the 2025 baseline, the sustainable packaging market has roughly doubled in a decade.
The compound annual growth rate from 2015 to 2025 has been approximately 7–8%, consistently outpacing the total packaging market’s 3.5–4% growth rate over the same period.
Eight inflection points have shaped the trajectory of global sustainable packaging market growth:
- 2015 — The EU Circular Economy Action Plan established the policy direction that would drive European sustainable packaging demand for the next decade.
- 2018 — The Ellen MacArthur Foundation and UNEP launched the New Plastics Economy Global Commitment with 250+ initial signatories, which created the first large-scale voluntary framework for corporate packaging targets.
- July 2021 — The EU Single-Use Plastics Directive entered force, banning 10 single-use plastic items and mandating 25% recycled content in PET bottles by 2025, rising to 30% by 2030.
- April 2022 — The UK Plastic Packaging Tax took effect at £200 per tonne on packaging with less than 30% recycled content.
- July 2022 — India’s single-use plastic ban targeting 19 specific items came into force under the Plastic Waste Management Amendment Rules.
- 2022–2024 — Five U.S. states enacted Extended Producer Responsibility (EPR) laws for packaging: California (SB 54), Maine, Oregon, Colorado, and Minnesota.
-
2024–2025 — A major consolidation wave reshaped the industry:
- Smurfit Kappa merged with WestRock (USD 34 billion),
- International Paper acquired DS Smith (USD 7.2 billion),
- Amcor merged with Berry Global, and
- Novolex acquired Pactiv Evergreen.
-
February 2025 — The EU Packaging and Packaging Waste Regulation (PPWR) entered force, mandating 30% recycled content for PET food packaging by 2030, banning intentionally added PFAS in food-contact packaging, and setting binding reuse targets.
General application begins August 2026.
The market grew through the 2020–2021 pandemic at roughly 6–8% annually as e-commerce volumes more than offset disruption to reusable packaging systems.
Smithers reported total packaging demand up 5.8% year-on-year during 2018–2021, with sustainable formats growing faster than the average.
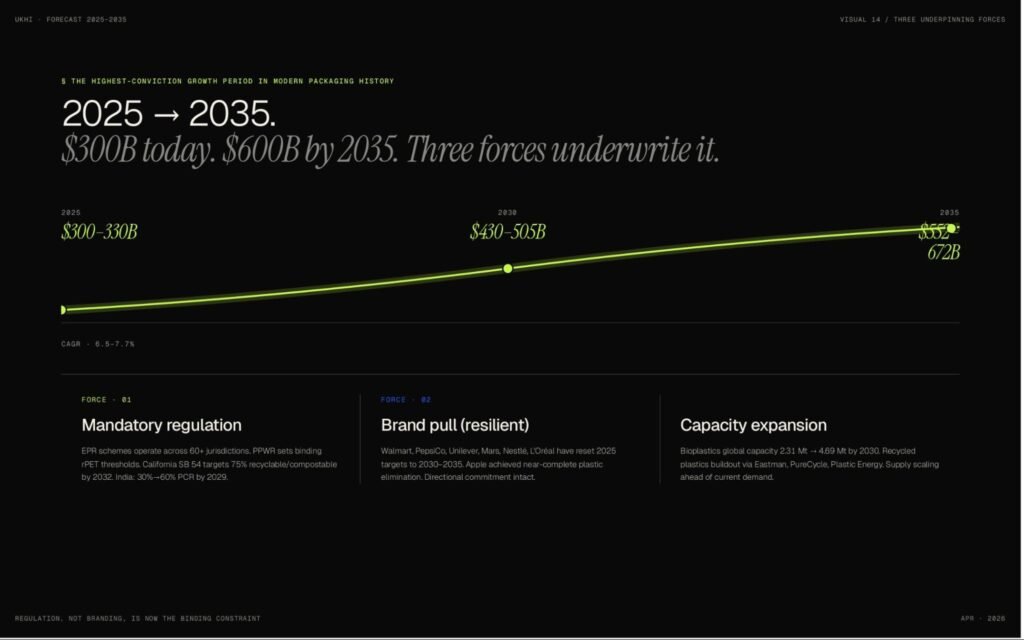
2.2 Sustainable Packaging Market Forecast: 2025–2035
The forward decade is the highest-conviction growth period in the modern history of packaging.
The sustainable packaging market forecast clusters around three ranges:
- By 2030: USD 430–505 billion
- By 2035: USD 552–672 billion
- CAGR through the period: 6.5–7.7%
Three forces underpin this forecast.
Regulation has shifted from voluntary to mandatory.
- Extended Producer Responsibility schemes now operate across 60+ jurisdictions globally.
- The EU PPWR sets binding recycled-content thresholds across all packaging types.
- California’s SB 54 targets 75% recyclable or compostable packaging by 2032.
- India’s recycled content mandate for rigid plastics started at 30% in April 2025 and rises to 60% by 2029.
Brand commitments continue to pull sustainable formats into procurement, even when timelines slip.
- Walmart, PepsiCo, Unilever, Mars, Nestlé, and L’Oréal have all either missed or reset their 2025 packaging targets, pushing deadlines to 2030 or 2035.
- Several of these companies have exited the U.S. Plastics Pact.
But the directional commitment remains intact, and the regulatory environment now means that even if voluntary pledges weaken, mandatory requirements will fill that gap.
Apple is the standout success story, achieving near-complete plastic packaging elimination ahead of its end-2024 target.
Production capacity for sustainable materials is expanding faster than current demand.
- European Bioplastics projects global bioplastics production capacity will reach 4.69 million tonnes by 2030, roughly doubling from 2.31 million tonnes in 2025.
- Recycled plastics capacity is being built out aggressively, driven by chemical recycling investments from companies like Eastman, PureCycle, and Plastic Energy.
Insight — Regulation, Not Branding, Is Now the Binding Constraint:
The most important industry-wide development of 2024–2025 is the gap between corporate sustainability pledges and actual performance.
Multiple major brands have missed targets or exited voluntary commitments.
Yet the market continues to grow because regulatory mandates now set the floor.
The sustainable packaging growth story has shifted from “brands want to” to “regulations require it.”
What Explains the Wide Range in Sustainable Packaging Market Forecasts?
The variance across research firms is driven primarily by differences in scope, not in analytical method.
Four factors account for most of the gap:
-
Whether all paper packaging counts as sustainable.
This is the single largest variable.
Including all paper and cardboard packaging adds USD 150–200 billion to the total.
Firms that count only paper formats actively replacing conventional plastic arrive at much lower figures.
-
Whether recycled-content conventional plastic counts.
Classifying a PET bottle with 30% rPET as fully “sustainable” inflates the market by 30–50%.
-
Whether glass and metal are included.
Adding these materials raises the baseline by a further USD 80–150 billion.
-
Methodology and base year.
Firms using top-down approaches and older base years (2022 or 2023) tend to produce estimates that diverge from those using bottom-up segment aggregation with more recent data.
The most robust interpretation for decision-makers is that the sustainable packaging market will cross USD 450 billion around 2030 and approach USD 600 billion by 2035, growing at roughly twice the rate of total packaging.
2.3 Sustainable Packaging Market Composition by Material Type
The five material categories that make up the sustainable packaging market are wildly unequal in size but inversely ranked on growth.
Paper dominates revenue.
Bioplastics lead on growth rate.
Understanding this asymmetry is essential before reading the material-specific market analysis that follows.
| Material Category | 2025 Market Size (USD) | Approximate Share | CAGR |
|---|---|---|---|
| Paper and cardboard | $255–290 billion (see note below) | ~80–85% | 4.3–5.1% |
| Recycled plastics packaging | $17–29 billion | ~5–7% | 5.8–10% |
| Bioplastics packaging | $17–25 billion | ~4–6% | 12–17% |
| Molded fiber and pulp | $5–11 billion | ~2% | 5–7% |
| Emerging bio-materials | <$1 billion | <0.3% | 6–10% |
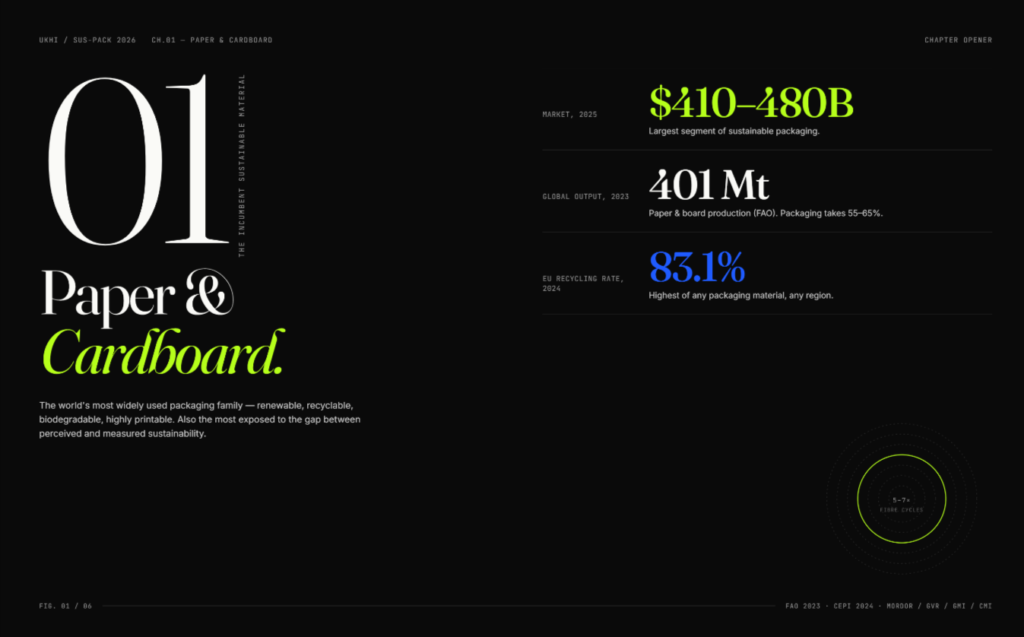
Paper and Cardboard — The Dominant Segment
Paper and cardboard packaging accounts for the overwhelming majority of the sustainable packaging market by value.
The total global paper and paperboard packaging market is USD 410–480 billion in 2025 (detailed in the Paper and Cardboard chapter later), but not all of that is classified as “sustainable packaging” by market research firms.
Most firms include only paper packaging that actively replaces conventional plastic, carries certified recycled or FSC/PEFC content, or meets specific environmental performance criteria.
Commodity corrugated and standard folding cartons without sustainability certification are generally counted as “packaging” rather than “sustainable packaging,” even though paper as a material is renewable and recyclable.
The sustainable subset (the portion included in the USD 300–330 billion total sustainable packaging market) is estimated at roughly USD 255–290 billion.
This scope distinction is the single largest reason sustainable packaging market estimates vary so widely across research firms.
Bioplastics Packaging — The Fastest-Growing Segment
The bioplastics packaging market size was estimated at USD 17–25 billion in 2025, which is similar in absolute terms to recycled plastics, but growing far faster at 12–17% CAGR.
This makes bioplastics the highest-growth material category in sustainable packaging by a significant margin.
European Bioplastics’ 2025 market data report provides the most defensible volume anchor: global bioplastics production capacity of 2.31 million tonnes in 2025 with actual production of 1.67 million tonnes at 72% utilisation.
Global bioplastics production capacity is projected to reach 4.69 million tonnes by 2030.
Packaging accounts for 41.3% of total bioplastics production.
Bioplastics remain approximately 0.5% of total global plastics production of 431 million tonnes, which is small in absolute terms.
Still, the growth trajectory is the steepest in the industry.
Recycled Plastics Packaging — The Regulatory Beneficiary
The recycled plastics packaging market size was pegged at USD 17–29 billion in 2025, with the broader recycled plastics market across all applications at USD 60–73 billion.
Growth is driven almost entirely by regulatory mandates such as the EU’s 30% recycled content target for PET bottles, the UK’s plastic packaging tax, and India’s escalating PCR requirements.
The recycled plastics market faces a structural tension: demand for food-grade recycled content is rising faster than supply, with rPET commanding an approximately 80% price premium over virgin PET in mid-2025.
Chemical recycling is the wildcard, with capacity announcements totalling 9 million tonnes per year globally, but actual commercial output remains a fraction of that.
Molded Fiber and Pulp — The EPS Replacement Story
The molded fiber packaging market size was estimated at USD 5–11 billion in 2025.
The wide range exists because some research firms use a narrow “molded pulp” definition that covers only traditional wet-pressed products like egg cartons and fruit trays (yielding the lower figure), while others use a broader “molded fiber” definition that also includes thermoformed food service packaging and moulded protective inserts for electronics (yielding the higher figure).
The consensus growth rate for molded fiber packaging is 5–7% CAGR, which places it in the middle of the pack (faster than paper and cardboard but slower than bioplastics or recycled plastics).
The category’s growth is anchored on replacing expanded polystyrene (EPS) in food service packaging (clamshells, trays, cup lids) and electronics protective packaging.
More than 100 jurisdictions have now banned EPS.
Apple, Google, and Amazon have all shifted to fiber-based protective packaging in recent years.
Molded fiber packaging adoption is growing fastest in Asia-Pacific, particularly in China and India, driven by both strong production capacity (India’s sugarcane industry generates large volumes of bagasse, the primary feedstock for moulded fiber food service packaging) and rising domestic demand as local EPS bans take effect.
Emerging Bio-Materials — Small Scale But Large Ambition
Emerging bio-materials market — mycelium composites, seaweed-based packaging, agricultural waste composites, edible coatings — remain commercially tiny.
Combined market value is under USD 1 billion.
Mycelium packaging sits at approximately USD 85–95 million; seaweed packaging at USD 600–800 million (though much of this is broader food-industry seaweed, not packaging-specific).
These materials matter not for their current revenue contribution but for their long-term disruption potential and for the outsized search interest they generate.
The Takeaway:
Paper carries the absolute dollars.
Bioplastics carry the growth rate.
This asymmetry defines the sustainable packaging investment landscape.
For a procurement decision-maker, paper is the safe, scaled, available option today.
For an investor or strategic planner looking at the 2030–2035 horizon, bioplastics and recycled plastics are where the market is shifting fastest, and where regulatory tailwinds are strongest.
3. Paper and Cardboard Packaging — Market Size, Growth, and Sustainability Analysis
3.1 What Is Paper and Cardboard Packaging?
Paper and cardboard packaging is made from cellulose fibers, which can be either virgin wood pulp or recycled paper fiber.
The fibers are formed into sheets, boards, or molded shapes that serve as packaging to protect, transport, and present products.
Paper and cardboard make the world’s most widely used packaging family, valued for being renewable, recyclable, biodegradable, and highly printable.
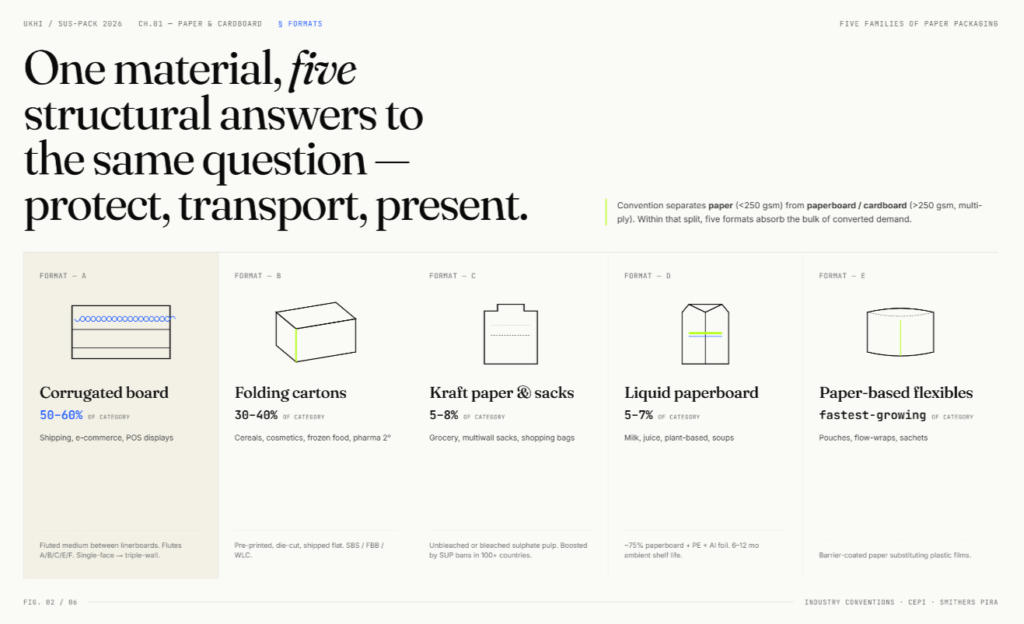
The convention separates paper (lighter substrates, generally under 250 gsm) from paperboard or cardboard (thicker, multi-ply, more rigid materials above 250 gsm).
Raw material for this category of packaging comes from two sources:
- Virgin wood pulp, produced through chemical (Kraft/sulphate) or mechanical pulping processes, and
- Recovered fiber from wastepaper collection, which now supplies roughly 54% of paper packaging raw material globally, with each cellulose fiber cycling through approximately five to seven uses before becoming too short for structural applications.
Virgin fiber is essential for food-contact grades, high-strength linerboard, and liquid paperboard.
Responsible sourcing is tracked through FSC (Forest Stewardship Council, certifying approximately 150 million hectares) and PEFC (Programme for the Endorsement of Forest Certification, covering approximately 295 million hectares).
Together, these schemes cover roughly 10–11% of the world’s total forest area.
Key Limitation — Barrier Properties:
Paper has inherently poor moisture, oxygen, and grease barrier properties.
Uncoated paper has water vapour transmission rates over 100 times too high for most moisture-sensitive foods, and oxygen transmission rates that exceed industry thresholds by two to three orders of magnitude.
This is why barrier coatings such as polyethylene lamination, wax, or newer bio-based alternatives are central to paper packaging’s functionality, and why those coatings create the recyclability trade-offs discussed later in this chapter.
3.2 Types of Paper and Cardboard Packaging
-
Corrugated board — The dominant format, accounting for roughly 50–60% of paper packaging market value globally.
It sandwiches a fluted “medium” between flat linerboards, with different flute profiles (A, B, C, E, F) to determine cushioning and printability.
Walls range from single-face to triple-wall depending on the stacking strength required.
This is the format prevalent for shipping boxes, e-commerce packaging, and point-of-sale displays.
-
Folding cartons — Pre-printed, die-cut paperboard structures shipped flat and erected at the point of fill.
This is the prevalent format for cereal boxes, cosmetics packaging, frozen-food cartons, and pharmaceutical secondary packaging.
Made from Solid Bleached Sulphate (SBS), Folding Box Board (FBB), or recycled White Lined Chipboard (WLC).
-
Kraft paper and paper bags — Unbleached or bleached sulphate-pulp paper used for grocery bags, shopping bags, multiwall sacks (cement, flour, animal feed), and protective wrapping.
Single-use plastic bans across more than 100 countries have significantly increased its adoption.
-
Liquid paperboard and aseptic cartons — The Tetra Pak format.
Multilayer structures of roughly 75% paperboard combined with thin polyethylene layers and often aluminium foil, used for milk, juice, plant-based beverages, and soups.
Aseptic processing enables 6–12 month ambient shelf life without refrigeration.
-
Paper-based flexible packaging — Pouches, flow-wraps, and sachets made from barrier-coated paper, substituting conventional plastic films.
This is one of the fastest-growing sub-segments in the category.
3.3 Paper Packaging Market Size and Growth
The total global paper and cardboard packaging market size was in the range of USD 410–480 billion in 2025.
This makes paper and cardboard the world’s largest packaging material category by a wide margin.
This figure covers all paper and paperboard packaging — corrugated shipping boxes, folding cartons, liquid paperboard, paper bags, and paper-based flexibles — regardless of whether a given product is specifically marketed or certified as “sustainable.”
A subset of this total, estimated at roughly USD 255–290 billion, is what market research firms classify as sustainable packaging when sizing the overall sustainable packaging market (as discussed in Chapter 2).
The difference reflects commodity corrugated and standard cartons that do not carry sustainability certification but are made from a material that is inherently renewable and widely recycled.
The market size estimates from individual research firms below reflect the total paper packaging market, not only the sustainable subset.
Complete Paper Packaging Market Size Estimates by Research Firm
| Research Firm | Market Size Estimate | Forecast | CAGR |
|---|---|---|---|
| Mordor Intelligence (2026) | USD 480.0B | USD 601.7B by 2031 | 4.6% |
| Grand View Research (2025) | USD 416.1B | USD 611.7B by 2033 | 5.0% |
| Global Market Insights (2024) | USD 410.5B | USD 596.5B by 2034 | 3.8% |
| Coherent Market Insights (2025) | USD 450.0B | USD 629.4B by 2032 | 4.9% |
Market Size by Sub-Segment
Note: The sub-segment figures below refer to the total paper packaging market, not only the sustainable subset discussed in Chapter 2.
Some sub-segments overlap in scope across research firms (for example, paper-based flexible packaging estimates vary widely depending on whether coated and laminated structures are included), so the sub-segment figures should not be summed to arrive at the total.
-
Corrugated packaging — The largest sub-segment, estimated at USD 230–325 billion in 2025 depending on scope.
On a volume basis, global corrugated production has reached roughly 275 billion square metres in 2025, more than doubling from 128 billion square metres in 2005.
Growth runs at 4–5% CAGR, driven primarily by e-commerce shipping volumes.
- Folding cartons — Strong analyst consensus at USD 140–200 billion in 2024, growing at 4.4–5.5% CAGR.
- Paper bags — Estimated at USD 6–12 billion, growing 5–6%, boosted by single-use plastic bag bans across jurisdictions.
- Liquid paperboard and aseptic cartons — The strongest growth rate in the paper category at USD 24–30 billion in 2024 with 7–8% CAGR, driven by emerging-market dairy consumption, plant-based beverages, and plastic bottle substitution.
- Paper-based flexible packaging — Ranges from USD 58–130 billion depending on whether foil-laminated and coated structures are included.
Production Volume
The FAO recorded 401 million tonnes of global paper and board production in 2023.
Packaging now claims roughly 55–65% of that total.
CEPI (the Confederation of European Paper Industries) reported that European paper and board production rebounded 5.2% in 2024 to approximately 78 million tonnes, with packaging-grade output up 6.5%.
In the United States, AF&PA reported production up 3.2% in 2024, with containerboard accounting for over 50% of total US capacity.
Stat: Europe’s paper and board packaging recycling rate reached 83.1% in 2024, the highest of any packaging material in any region globally.
The 4evergreen industry alliance targets 90% by 2030.
3.4 Geographic Hotspots for Paper Packaging
Asia-Pacific — The Volume Leader
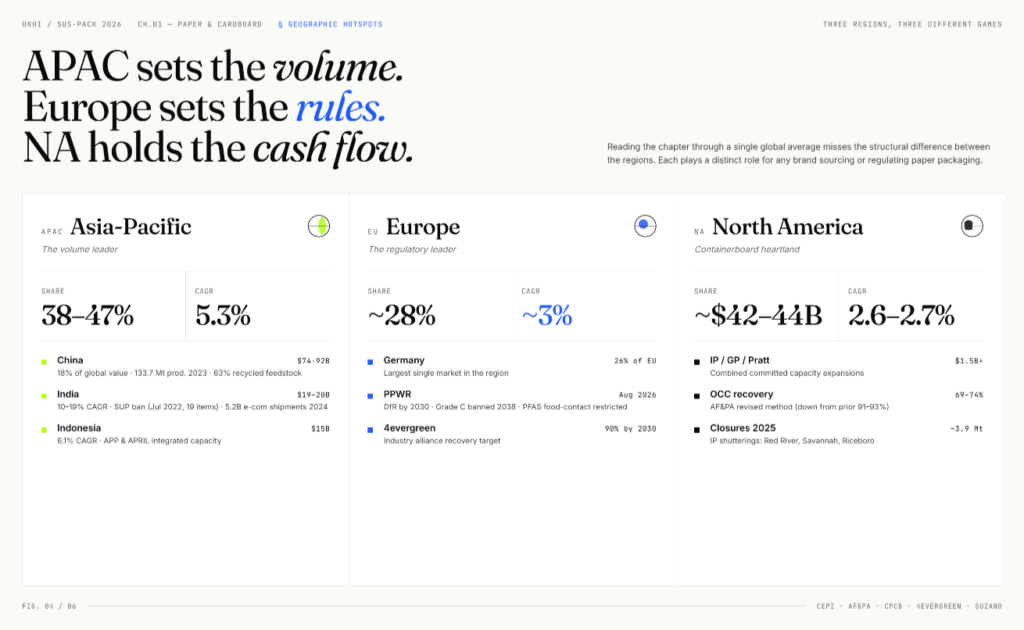
Asia-Pacific holds 38–47% of the global paper packaging market and is the fastest-growing region at approximately 5.3% CAGR.
China is the world’s largest paper producer, manufacturing 133.7 million tonnes in 2023 alone. The China paper packaging market is estimated at USD 74–92 billion in 2025, which is 18% of global value. Nine Dragons Paper, the country’s largest producer, carries 21.7 million tonnes of design capacity. Recycled fiber dominates Chinese feedstock at 63% share.
India is one of the fastest-growing major paper packaging markets globally, estimated at USD 19–20 billion in 2025 and projected to grow at 10–19% CAGR depending on scope. Two forces drive demand: the July 2022 single-use plastic ban targeting 19 items (backed by over 860,000 inspections), and e-commerce shipment volumes that grew from 3.8 billion in 2023 to 5.2 billion in 2024. Recycled fiber supplies approximately 75% of Indian paper production. Major capacity investments include ITC’s barrier-coating line, SIG’s new aseptic carton plant in Ahmedabad (4 billion packs per year), and expansions by JK Paper, Oji India, and Huhtamaki India.
Indonesia is emerging as a production hub at USD 15 billion and 6.1% CAGR, with APP and APRIL controlling massive integrated capacity.
Europe — The Regulatory Leader
Europe’s paper packaging market contributes approximately 28% of global value, estimated at around USD 110 billion in 2025. Growth is slower than Asia-Pacific, but Europe has the world’s most developed recycling infrastructure and the most binding regulation.
The EU Packaging and Packaging Waste Regulation (PPWR), which entered into force in February 2025 and applies from August 2026, sets several provisions directly affecting paper packaging:
- All packaging must be designed for recycling by 2030 (graded A/B/C only; grade C banned from 2038).
- E-commerce packaging must not exceed 50% empty space relative to the product being shipped.
- PFAS restricted in food-contact packaging from August 2026.
- Packaging waste reduction of 5% by 2030 and 15% by 2040 versus 2018 baseline.
Germany alone accounts for 26% of the European paper packaging market.
North America — The Containerboard Heartland
The North American corrugated packaging market is estimated at USD 42–44 billion, and is growing at 2.6–2.7% CAGR.
Growth is slower than other regions, but absolute investment is significant, with International Paper, Georgia-Pacific, and Pratt Industries collectively committing over USD 1.5 billion in capacity expansions.
One notable data revision: AF&PA changed how it calculates recycling rates in 2024, and the updated methodology now reports US old corrugated container (OCC) recovery at 69–74%. Under the previous calculation method, the same metric was reported at 91–93%. The lower figure is considered more accurate because it accounts for exported material that may not actually be recycled at its destination.
Other Key Markets
- Japan — Paper packaging projected at USD 24 billion by 2026, with Oji and Nippon Paper leading innovation.
- Brazil — The global pulp powerhouse.
Suzano’s Cerrado Project, which opened in July 2024, is the world’s largest single-line pulp mill at 2.55 million tonnes per year of eucalyptus pulp, representing a USD 4.3 billion investment.
3.5 Key Applications and End-Use Sectors for Paper Packaging
E-Commerce and Shipping
E-commerce is the single biggest demand driver for paper and cardboard packaging. The sector consumes roughly 55 billion corrugated cartons annually worldwide.
Amazon’s packaging programs have eliminated more than 2 million tonnes of packaging materials since 2008, and in 2024 the company replaced approximately 15 billion plastic air pillows globally with recycled paper filler.
Walmart replaced 65 million plastic mailers per year with recyclable paper mailers across US fulfilment.
Food and Beverage
Food and beverage is the largest end-use sector overall, accounting for approximately 54% of paper packaging demand. Liquid packaging cartons dominate in beverages, with Tetra Pak, SIG, and Elopak as the main producers.
Healthcare, Personal Care, and Confectionery
- Healthcare — Paper-based pharmaceutical packaging is advancing through innovations like PulPac’s Blister Pack Collective, which aims to eliminate over 100,000 tonnes per year of pharmaceutical plastic packaging.
- Personal care — L’Oréal has deployed paper tubes for La Roche-Posay and Garnier (45% plastic reduction); Lush’s “Naked” range has avoided an estimated 30 million plastic bottles since 2010.
- Confectionery — Nestlé’s Smarties became the first global confectionery brand to move to fully recyclable paper packaging. It eliminated over 400 tonnes of plastic. Frugalpac’s recycled paperboard wine bottle is now used by 45 brands across 25 countries, with an 84% lower carbon footprint than glass.
3.6 The Paper Packaging Sustainability Debate
Paper is widely perceived as the default “sustainable” packaging choice. The reality is more nuanced than that perception suggests.
Paper vs Plastic — Carbon Footprint Comparison
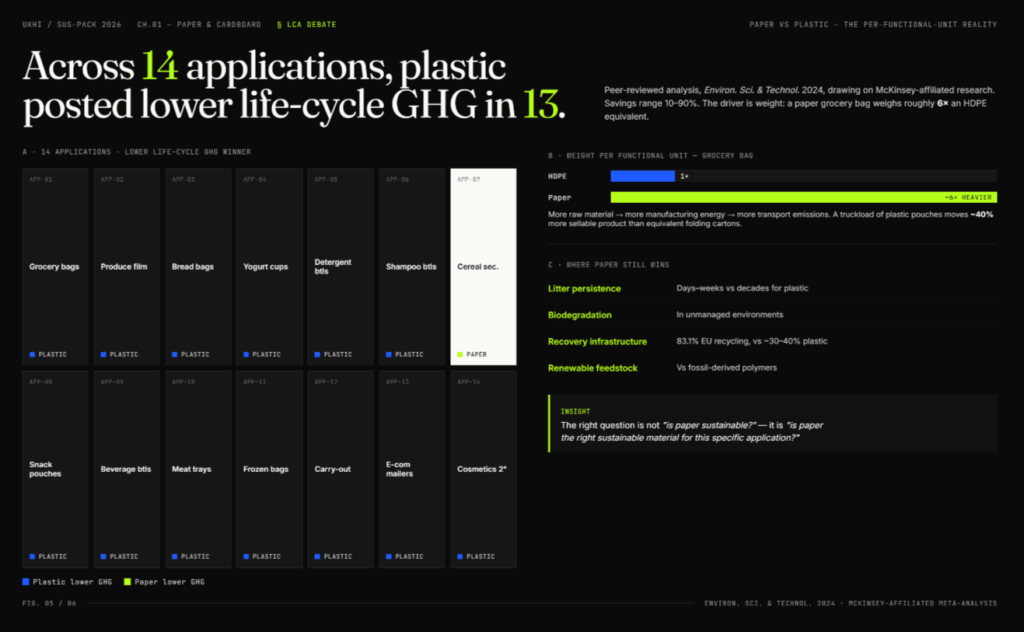
Not necessarily. A peer-reviewed analysis published in Environmental Science & Technology (2024), drawing on McKinsey-affiliated research, found that across 14 packaging applications studied, plastics had lower life-cycle greenhouse gas emissions in 13 cases, with savings of 10–90%.
The primary reason is weight:
- a paper grocery bag weighs roughly six times more than an HDPE bag for similar carrying capacity
- this translates into more raw material, more manufacturing energy, and more transport emissions.
But when comparing the carbon footprint of paper and plastic packaging designed to do the same job, the result depends on the specific application. Paper does not automatically win on carbon, and in many cases it does not win at all.
Deforestation and Forest Management
Pulp and paper consume 33–40% of all industrial wood traded globally.
WWF identifies pulp as a relevant deforestation driver in 5 of 11 global deforestation fronts, particularly in Sumatra.
Only 10–11% of the global forest area is FSC- or PEFC-certified, and NGO scrutiny of certification standards is intensifying.
The EU Deforestation Regulation now requires due diligence on wood, paper, and pulp products entering the European market.
PFAS in Paper Packaging
PFAS (per- and polyfluoroalkyl substances) have been widely used as grease-proofing agents in food-contact paper packaging. The regulatory landscape for these is shifting rapidly:
- The US FDA announced in February 2024 that manufacturers had ceased sales of grease-proofing PFAS for food-contact use.
- At least 16 US states have enacted PFAS bans for food packaging.
- The EU PPWR restricts PFAS in food-contact packaging from August 2026.
- Alternatives (silicone coatings, plant-based barriers, mineral coatings) are commercially available but typically at 30–60% cost premiums.
Insight — “Paper-Washing” Is a Risk
Consumer research consistently shows that shoppers are 30–40% more likely to perceive a product as sustainable when packaged in paper, regardless of the underlying life-cycle performance. This makes paper substitution a marketing opportunity but one that regulators are now constraining through the EU Green Claims Directive and PPWR labelling rules. Brands that switch to paper primarily for optics, without genuine environmental benefit, face growing reputational and legal exposure.
3.7 Paper Packaging Market Drivers and Challenges
3.7.1 Growth Drivers for Paper Packaging
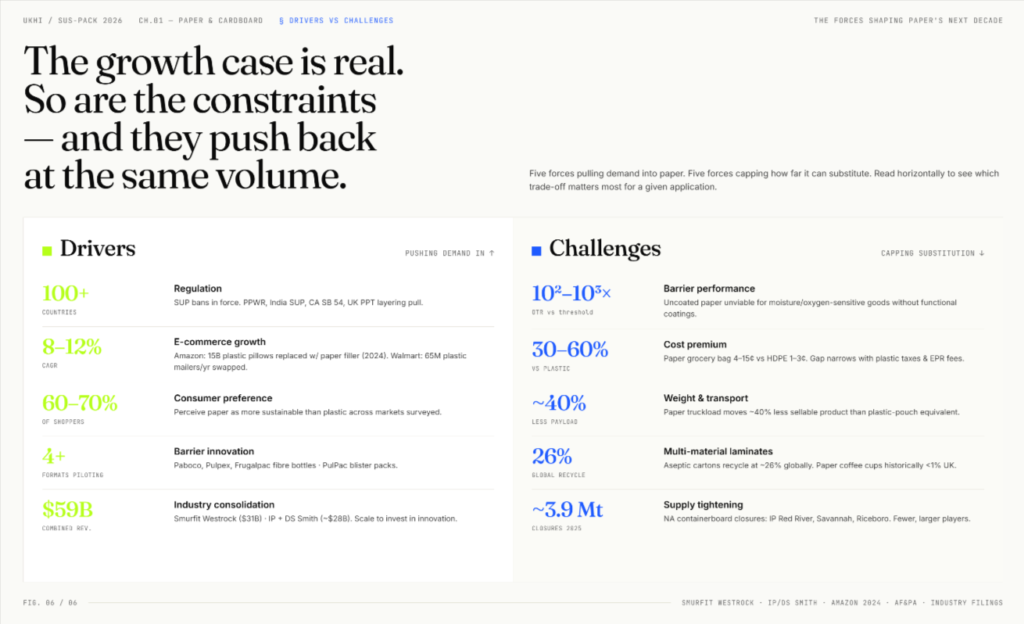
Regulation is the most powerful demand driver. Single-use plastic bans are now in force across more than 100 countries, and these bans directly shift demand toward paper in bags, wraps, food service, and retail packaging. The EU PPWR, India’s single-use plastic ban, California’s SB 54, and the UK’s plastic packaging tax are all layering additional regulatory pull.
E-commerce growth continues to expand corrugated demand at 8–12% annually. Amazon, Walmart, and Target have all moved away from plastic packaging in fulfilment toward paper-based alternatives.
Consumer preference for paper is strong and consistent, with 60–70% of consumers perceiving paper packaging as more sustainable than plastic in surveys conducted across multiple markets.
Innovation in barrier coatings is expanding paper into new applications that were previously reserved for plastics — chilled and frozen food, snack packaging, personal care.
Fiber-based bottles from Paboco, Pulpex, and Frugalpac are being piloted by Coca-Cola, PepsiCo, Diageo, and L’Oréal.
Paperboard blister packs for pharmaceuticals are under development with Sanofi through the PulPac Blister Pack Collective.
Industry consolidation — the Smurfit Kappa–WestRock merger (creating Smurfit Westrock, USD 31 billion revenue) and International Paper’s acquisition of DS Smith (approximately USD 28 billion combined) — has created two global operators with the scale to invest in innovation, rationalise capacity, and serve multinational brands efficiently.
3.7.2 Challenges and Limitations of Paper Packaging
Barrier performance remains the fundamental constraint. Uncoated paper cannot serve moisture-sensitive foods, oxygen-sensitive snacks, carbonated beverages, or pharmaceutical blister packs without functional coatings. The coatings that restore performance (PE lamination, wax) compromise recyclability, and newer bio-based alternatives command 10–35% price premiums while still lagging conventional coatings on oxygen-barrier performance.
Cost is higher than plastic at the converted-package level, typically by 30–60% for equivalent functionality. A paper grocery bag costs 4–15 cents against 1–3 cents for an HDPE bag. This gap narrows when plastic taxes and EPR fees are factored in, but it has not yet closed in most applications.
Weight and transport emissions represent paper’s most consistent disadvantage in life-cycle assessments. A truckload of plastic pouches moves approximately 40% more sellable product than an equivalent load of folding cartons. For brands shipping by air freight, this weight penalty translates directly into higher emissions.
Multi-material laminates remain a recycling problem. Tetra Pak aseptic cartons (75% paperboard, 20% polyethylene, 5% aluminium) recycle at roughly 26% globally. Paper coffee cups historically recycled at under 1% in the UK. Both formats face high regulatory risk under PPWR’s recyclability grading system.
Supply tightening through consolidation — North American containerboard producers announced closures totalling approximately 3.9 million tonnes in 2025, led by International Paper shuttering facilities at Red River, Savannah, and Riceboro. New recycled-content capacity is being built, but the net effect is a market with fewer, larger players and greater pricing discipline for buyers.
The Bottom Line
Paper packaging will continue to grow, supported by regulation, e-commerce expansion, and consumer preference. But the constraints are equally strong — barrier limitations, cost premiums, weight penalties, and recyclability compromises from coatings. The right question for a packaging decision-maker is not “is paper sustainable?” but “is paper the right sustainable material for this specific application?” Answering that honestly requires functional-unit life-cycle data.
4. Bioplastics Packaging — Market Size, Types, and Growth Analysis

4.1 What Are Bioplastics?
Bioplastics are plastics that are either:
- bio-based (derived from biological feedstocks such as corn starch, sugarcane, or cellulose),
- biodegradable (capable of breaking down through natural biological processes under specific conditions),
- or both.
The term covers a wide range of polymers with very different properties, end-of-life behaviours, and recycling compatibility.
The clearest way to understand the category is through the framework maintained by European Bioplastics, which maps bioplastics along two independent axes:
- whether the feedstock is bio-based or fossil-based, and
- whether the resulting polymer is biodegradable or non-biodegradable.
This produces three distinct product groups:
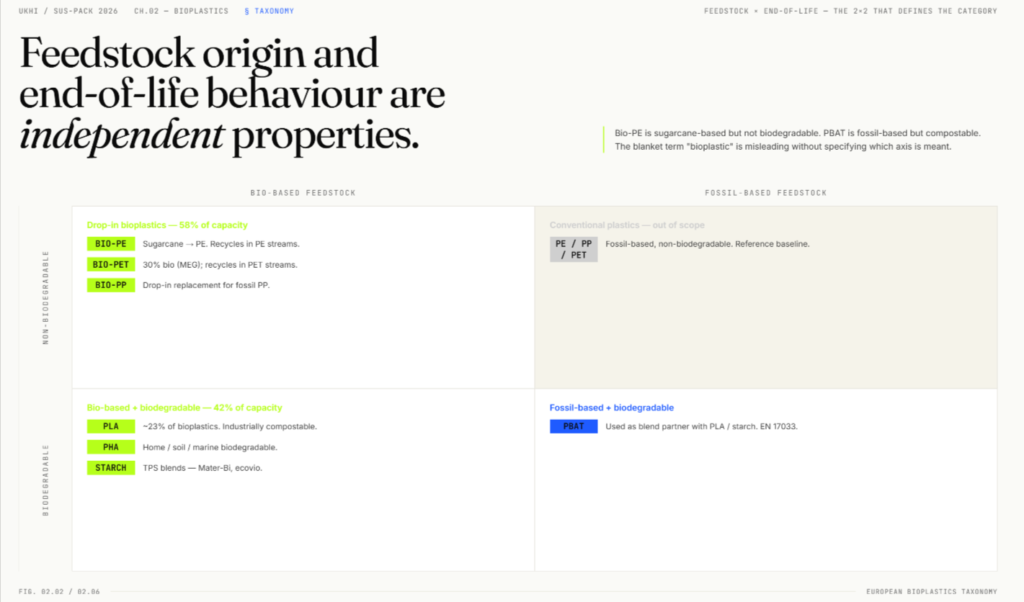
Bio-based, non-biodegradable (“drop-in” bioplastics)
These include bio-PE, bio-PET, and bio-PP.
They are chemically identical to their fossil-based equivalents, which means they perform the same way, recycle in the same streams, and are not biodegradable.
Their sustainability case rests entirely on the fact that the carbon in the polymer comes from plants rather than petroleum.
Drop-ins account for approximately 58% of global bioplastics capacity in 2025.
Bio-based and biodegradable
These include PLA (polylactic acid), PHA (polyhydroxyalkanoates), and starch blends.
They are made from biological feedstocks and can biodegrade under specific conditions, though the conditions required vary significantly by polymer type.
This group accounts for roughly 42% of capacity.
Fossil-based but biodegradable
The most important example is PBAT (polybutylene adipate terephthalate).
It is derived from fossil feedstocks but is industrially compostable and soil-biodegradable.
PBAT is almost always used as a blend partner with PLA or starch to improve flexibility and toughness.
European Bioplastics tracks PBAT under bioplastics only when it is produced from bio-based feedstock. Most commercial PBAT is fossil-derived and therefore falls outside the 100% capacity split above, but it is included in this chapter because of its central role in compostable packaging blends.
Key Distinction
The feedstock origin and the end-of-life behaviour of a bioplastic are independent properties.
For example:
- Bio-PE is made from sugarcane but is not biodegradable.
- PBAT is made from fossil feedstocks but is biodegradable and compostable.
This is why the blanket term “bioplastic” can be misleading without further specification.
4.2 Types of Bioplastics: Material Deep-Dives
4.2.1 PLA (Polylactic Acid)
PLA is the largest biodegradable bioplastic by production volume, accounting for roughly 23% of all bioplastics capacity in 2025.
It is produced by fermenting plant sugars (typically from corn or sugarcane) into lactic acid, which is then polymerised.
Properties: Clear, rigid, good printability, food-contact approved. Limited by a heat-deflection temperature near 55–60°C unless crystallised, which restricts use in hot-fill or microwave applications.
End-of-life: Industrially compostable under EN 13432 and ASTM D6400. Generally does not home compost because PLA requires temperatures above 55°C to begin hydrolysing. PLA also contaminates PET recycling streams at concentrations above 0.1%.
Key producers:
- NatureWorks (Ingeo brand, approximately 150,000 tonnes per year in Nebraska plus a new 75,000 tpa plant in Thailand), and
- TotalEnergies Corbion (Luminy brand, 75,000 tpa in Thailand, with cumulative production passing 100,000 tonnes in 2022).
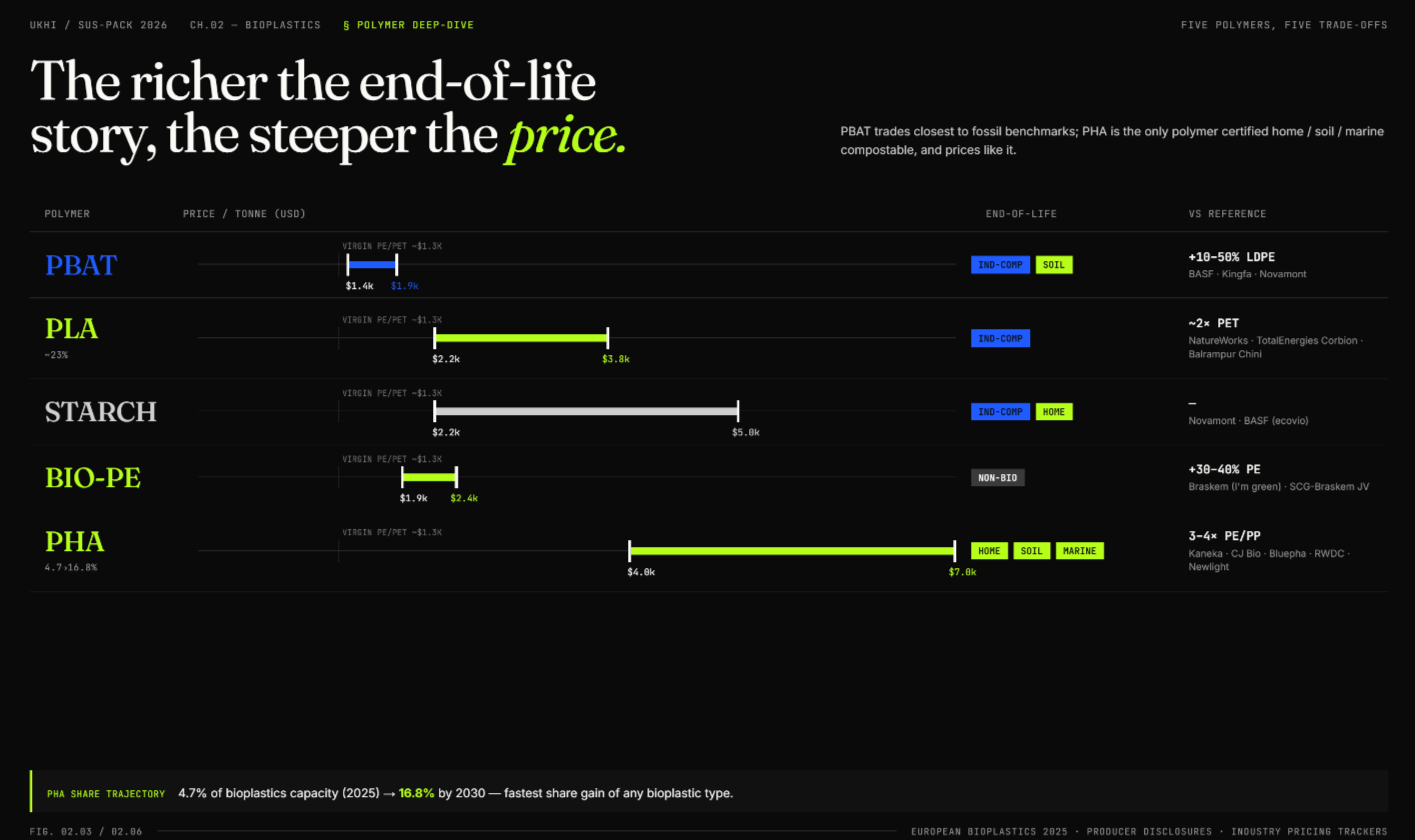
Price: USD 2,200–3,800 per tonne, roughly double the price of virgin PET.
PLA market size: The global PLA market is estimated at USD 3.5–5.5 billion in 2025, growing at 12–18% CAGR.
4.2.2 PHA (Polyhydroxyalkanoates)
PHA is the fastest-growing bioplastic family and the only commercial polymer certified as home compostable, soil biodegradable, and marine biodegradable.
PHA is produced through bacterial fermentation, where microorganisms convert sugars, oils, or even methane into polymer granules stored inside their cells.
Properties: Versatile — can range from stiff and brittle to flexible depending on the specific PHA type (PHB, PHBH, P3HB4HB). Good oxygen barrier properties. Slower crystallisation than PLA.
End-of-life: Home compostable (TÜV Austria OK compost HOME), soil biodegradable (OK biodegradable SOIL), and marine biodegradable (ASTM D6691). This is PHA’s unique regulatory and environmental advantage.
Key producers:
- Kaneka (PHBH brand, 20,000 tpa in Japan after 2024 expansion),
- CJ Biomaterials (5,000 tpa in Indonesia, expanding),
- Bluepha (5,000–25,000 tpa in China with a 75,000 tpa roadmap),
- RWDC Industries (scaling to 25,000 tpa by 2027 via used cooking oil feedstock), and
- Newlight Technologies (methane-to-PHA, Carbon Trust certified at −88 kg CO₂e per kg).
Price: USD 4,000–7,000 per tonne, approximately 3–4 times the cost of conventional PE or PP. Extraction and purification account for 30–50% of total production cost.
Industry note: Danimer Scientific, previously the most prominent US PHA producer (Nodax brand), filed for Chapter 11 bankruptcy in March 2025 and was sold for USD 19 million, highlighting the execution risk in PHA scale-up.
Stat: PHA’s share of global bioplastics capacity is forecast to grow from 4.7% in 2025 to 16.8% by 2030, according to European Bioplastics. This is the fastest share gain of any bioplastic type.
4.2.3 PBAT (Polybutylene Adipate Terephthalate)
PBAT is a fossil-based but biodegradable polyester used almost exclusively as a blend partner with PLA or starch to improve flexibility and toughness in compostable packaging applications such as bags, wraps, and agricultural mulch films.
Properties: Flexible, tough, good elongation at break. Certified industrially compostable (EN 13432) and soil biodegradable (EN 17033).
Key producers:
- BASF (ecoflex brand)
- Kingfa (China’s largest producer at roughly 320,000 tpa with 240,000 tpa more under construction)
- Novamont (used in Mater-Bi blends).
Ukhi produces PBAT-compatible compostable resin systems from agricultural residue feedstocks including rice husk, hemp, and crop stubble, formulated for blown film and cast film applications.
Chinese capacity dominates, with combined announced PBAT capacity exceeding 2.9 million tonnes — larger than all bio-based plastics combined.
Price: USD 1,400–1,850 per tonne, only 10–50% above conventional LDPE. Chinese FOB prices have fallen roughly 15% since 2023, making PBAT the most cost-competitive biodegradable polymer.
4.2.4 Starch Blends (TPS — Thermoplastic Starch)
Starch blends combine thermoplastic starch with biodegradable polyesters (typically PBAT or PLA) to produce compostable materials used primarily for carrier bags, bin liners, and food packaging films.
Novamont’s Mater-Bi and BASF’s ecovio are the best-known commercial brands.
In India, Ukhi produces home-compostable granules from agricultural residue (hemp, flax, rice husk, and crop stubble) under its EcoGran brand, targeting starch-blend and fiber-composite applications for food service and flexible packaging.
Properties: Cost-effective, good processability on conventional blown-film lines. Limited moisture resistance without blend partners.
Price: USD 2,200–5,000 per tonne depending on the blend ratio and performance grade.
Capacity: Approximately 141,000 tonnes in 2025. Novamont operates 150,000 tpa of Mater-Bi capacity in Italy (now fully owned by Versalis/Eni since October 2023).
Note: Ukhi’s EcoGran range spans blown film, profile extrusion, injection moulding, and cast film grades, and includes a biodegradable extrusion coating resin designed to replace conventional PE and PP coatings on paper substrates such as cups and food trays.
4.2.5 Bio-PE and Bio-PET (Drop-In Bioplastics)
Bio-PE and Bio-PET are chemically identical to conventional polyethylene and PET but are derived wholly or partly from bio-based feedstocks, primarily sugarcane ethanol.
Bio-PE: Bio-PE delivers a cradle-to-gate carbon footprint of approximately −2.1 to −3.1 kg CO₂e per kg, compared to +1.8 to +2.0 for fossil HDPE, because sugarcane absorbs CO₂ during growth.
Braskem’s I’m green brand is the global leader, with 275,000 tpa of bio-based ethylene capacity in Brazil (expanded in May 2025).
A 200,000 tpa joint venture with SCG Chemicals in Thailand is under front-end engineering.
Bio-PET: Currently only 30% bio-based (the MEG component from sugarcane; the PTA component remains fossil-derived).
Coca-Cola’s PlantBottle, which uses 30% bio-PET, has distributed roughly 35 billion bottles since 2009.
A 100% bio-based PET prototype was produced in partnership with Virent in 2021.
Key advantage: Drop-ins recycle in existing PET and PE streams with no contamination risk and no need for composting infrastructure. Their limitation is that they offer no end-of-life biodegradability as their case is purely about reducing fossil carbon input.
4.3 Bioplastics Market Size and Growth
The global bioplastics market size was estimated at USD 14–24 billion in 2025, with the range reflecting scope differences across research firms.
The most defensible volume estimate comes from the European Bioplastics 2025 market data report: global production capacity of 2.31 million tonnes in 2025, with actual production of 1.67 million tonnes at 72% utilization.
Global bioplastics capacity is projected to reach 4.69 million tonnes by 2030.
Bioplastics Market Size Estimates by Research Firm
| Research Firm | 2025 Size (USD) | Forecast | CAGR |
|---|---|---|---|
| Grand View Research | $18.4B | $67.4B by 2033 | 17.6% |
| MarketsandMarkets | $17.6B | $45.0B by 2030 | 20.7% |
| Precedence Research | $23.8B | $119.1B by 2035 | 17.5% |
| Fortune Business Insights | $14.8B | — | 23.3% |
| Mordor Intelligence | $15.6B | $28.9B by 2031 | 10.8% |
The bioplastics packaging market specifically is estimated at USD 17–25 billion in 2025, since packaging accounts for 41.3% of total bioplastics production.
Despite this share declining slightly from 45% in 2024 (as automotive applications grow faster), the absolute packaging volume is forecast to nearly triple to approximately 3 million tonnes by 2029.
Insight
Bioplastics remain approximately 0.5% of total global plastics production of 431 million tonnes. Even at 4.69 million tonnes by 2030, they will represent roughly 1% of the total. The strategic value of bioplastics lies not in replacing conventional plastics across the board, but in serving specific applications — particularly food service, compostable bags, and agricultural films — where regulation mandates compostable or bio-based alternatives and where the necessary composting infrastructure is available or being built.
4.4 Geographic Hotspots for Bioplastics
Asia-Pacific — The Production Leader
Asia-Pacific accounts for approximately 56% of global bioplastics production capacity in 2025, rising toward 63% by 2029.
Thailand has emerged as the global PLA hub, with NatureWorks and TotalEnergies Corbion operating a combined 150,000 tpa of capacity.
China dominates PBAT production, with Kingfa alone holding roughly 320,000 tpa and combined Chinese PLA plus PBAT capacity projected at 3.6 million tonnes.
India — The Strategic Growth Market
The India bioplastics market is estimated at USD 263–454 million in 2024 and believed to be growing at 12–20% CAGR depending on source.
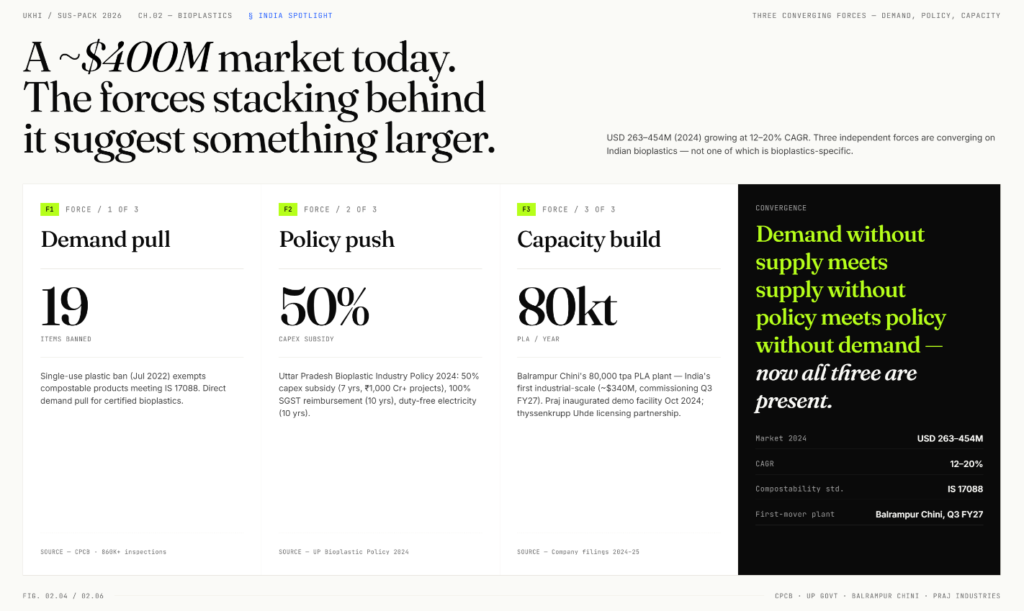
Three forces are converging to make India a critical bioplastics growth story:
- The July 2022 single-use plastic ban exempts compostable products meeting IS 17088; this has created a massive and direct demand pull for certified bioplastics.
- The Uttar Pradesh Bioplastic Industry Policy 2024 offers a 50% capital subsidy for seven years on bioplastics manufacturing investments above ₹1,000 crore, 100% SGST reimbursement for ten years, and ten years of duty-free electricity, anchored by a designated bioplastic park at Lakhimpur Kheri.
- Balrampur Chini Mills is building India’s first industrial-scale PLA plant at 80,000 tonnes per year (approximately USD 340 million investment, with commissioning expected Q3 FY27). Praj Industries inaugurated a PLA demonstration facility in October 2024 and partnered with thyssenkrupp Uhde to license complete PLA plants globally.
Europe — The Regulatory Leader
The Europe bioplastics market is valued at approximately USD 5.2–6.2 billion in 2025 (Mordor Intelligence), growing at 14–17% CAGR.
Europe holds only about 15% of production capacity but consumes 27–31% of global bioplastics value, making it the largest revenue market.
The EU PPWR mandates compostability from February 2028 for tea bags, coffee pods, and fruit stickers, creating new application-specific demand.
The Americas
North America holds approximately 16–19% of global bioplastics capacity, led by NatureWorks in Nebraska and emerging PHA producers. Brazil anchors the bio-PE story through Braskem’s 275,000 tpa facility.
4.5 Key Applications for Bioplastics Packaging
4.5 Key Applications for Bioplastics Packaging
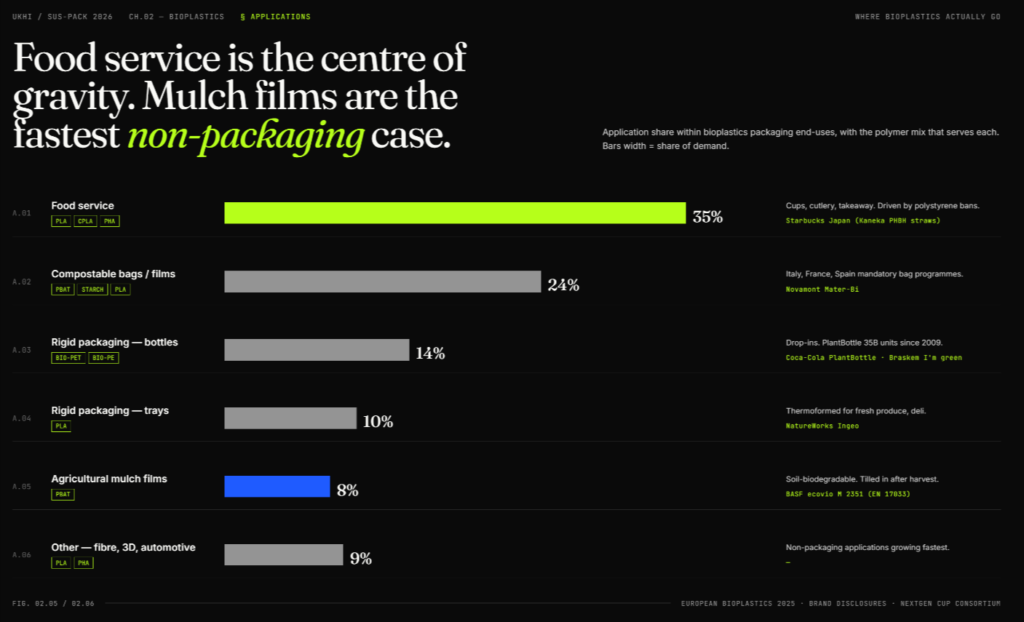
Food service packaging is the largest application for bioplastics, with majority of the demand in PLA cups, CPLA cutlery, and compostable takeaway container, particularly in jurisdictions that have banned polystyrene food service items (the EU’s July 2024 ban, plus over 100 city and state-level bans globally).
Kaneka’s PHBH straws are now used by Starbucks Japan, and the McDonald’s-Starbucks NextGen Cup Consortium has funded USD 10 million toward fiber cups with PLA or PHA liners.
Compostable bags and flexible films — primarily PBAT/starch blends — dominate in regions with mandatory compostable bag requirements, such as Italy (where Novamont’s Mater-Bi supplies a large share of the national market) and parts of France and Spain.
Rigid packaging splits between bio-PET drop-ins for bottles (Coca-Cola’s PlantBottle programme) and PLA thermoformed trays for fresh produce and deli items.
Outside of packaging, agricultural mulch films are a significant application for bioplastics.
These are thin films laid over crop rows to suppress weeds and retain moisture.
Conventional plastic mulch films must be collected and disposed of after use, which is expensive and often results in soil contamination.
Soil-biodegradable PBAT mulch films (such as BASF ecovio M 2351, certified to EN 17033) can be tilled directly into the soil after harvest, where they biodegrade in place, eliminating the cost and environmental burden of retrieval.
4.6 Bioplastics Market Drivers and Challenges
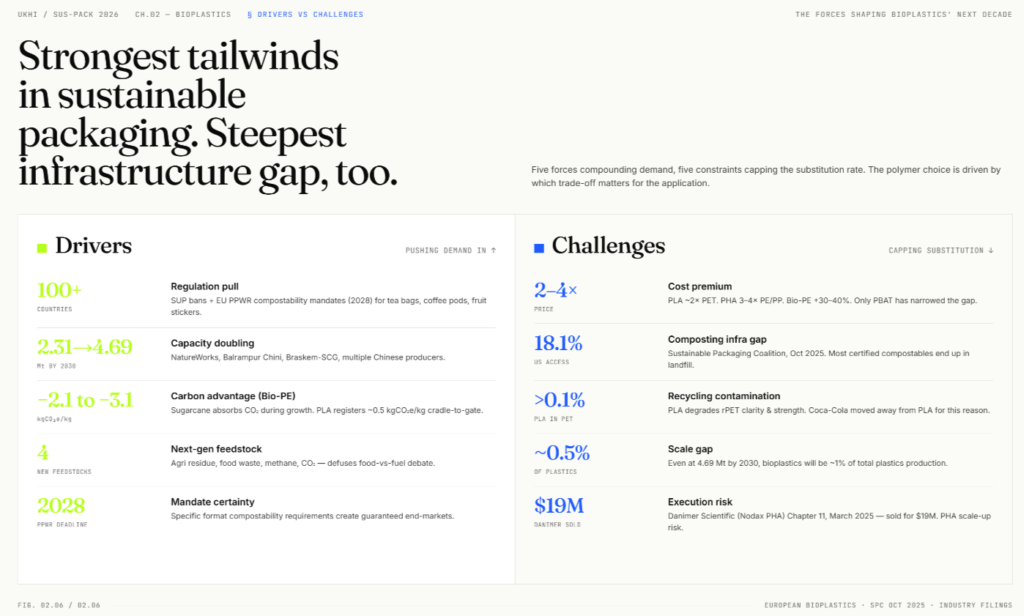
4.6.1 Growth Drivers for Bioplastics Packaging
Regulation is the primary demand driver. Single-use plastic bans in over 100 countries create direct substitution demand, and the EU PPWR’s compostability mandate for specific packaging formats (tea bags, coffee pods, fruit stickers) from 2028 establishes guaranteed end-markets for certified compostable bioplastics.
Capacity expansion is accelerating. Global bioplastics capacity is projected to roughly double from 2.31 million tonnes in 2025 to 4.69 million tonnes by 2030, with major new plants from NatureWorks, Balrampur Chini, Braskem-SCG, and multiple Chinese producers.
Carbon footprint advantages are measurable. Sugarcane-based bio-PE delivers cradle-to-gate emissions of −2.1 to −3.1 kg CO₂e per kg compared to +1.8 to +2.0 for fossil HDPE. PLA from sugarcane registers near 0.5 kg CO₂e per kg cradle-to-gate.
Next-generation feedstocks — agricultural residue, food waste, methane, and CO₂ — are attracting significant investment and defuse the food-versus-fuel debate that has historically constrained first-generation crop-based bioplastics.
4.6.2 Challenges and Limitations of Bioplastics Packaging
Cost premiums remain significant. PLA costs roughly double the price of PET. PHA costs 3–4 times the price of PE or PP. Bio-PE carries a 30–40% premium over fossil PE. Only PBAT has narrowed the gap materially, trading at 10–25% above LDPE in Asia.
Composting infrastructure is inadequate. The Sustainable Packaging Coalition reported in October 2025 that only 18.1% of the US population has access to organics programs that accept compostable packaging. In India, industrial composting capacity is minimal, which means most certified compostable packaging ends up in landfill where it does not compost as intended.
PLA contaminates PET recycling. At concentrations above 0.1%, PLA degrades the clarity and strength of recycled PET, which is why Coca-Cola moved away from PLA and toward bio-PET drop-ins for its PlantBottle programme. This recycling-stream incompatibility limits PLA’s addressable market in applications where bottles or containers might enter conventional recycling.
Consumer confusion about disposal remains widespread. Most consumers do not understand the difference between “biodegradable,” “compostable,” and “recyclable,” which leads to contamination in both composting and recycling streams.
The scale remains small. Bioplastics represent approximately 0.5% of total global plastics production. Even with capacity doubling by 2030, they will still account for roughly 1% of the total. This limits bargaining power with converters and brand owners accustomed to fossil-plastic supply chains measured in hundreds of millions of tonnes.
The Bottom Line
Bioplastics are the fastest-growing material category in sustainable packaging, with the strongest regulatory tailwinds and the steepest capacity expansion curve. But the growth story is not uniform across the category.
Drop-in bio-based polymers (bio-PE, bio-PET) offer the lowest-risk path for brands seeking to reduce fossil carbon input without changing recycling infrastructure.
PLA is approaching commodity-scale pricing as capacity expands, making it increasingly viable for food service and rigid packaging where industrial composting exists.
PHA offers the strongest end-of-life credentials but remains expensive and execution-risky.
The choice of a type of bioplastic depends on the application, the available infrastructure, and the claim the brand needs to make.
For deeper polymer economics, country-level analysis, and Indian producer mapping, see Ukhi’s Bioplastics Market Report 2025–2030.
5. Recycled Plastics Packaging — Market Size, Recycling Infrastructure, and Regulatory Mandates
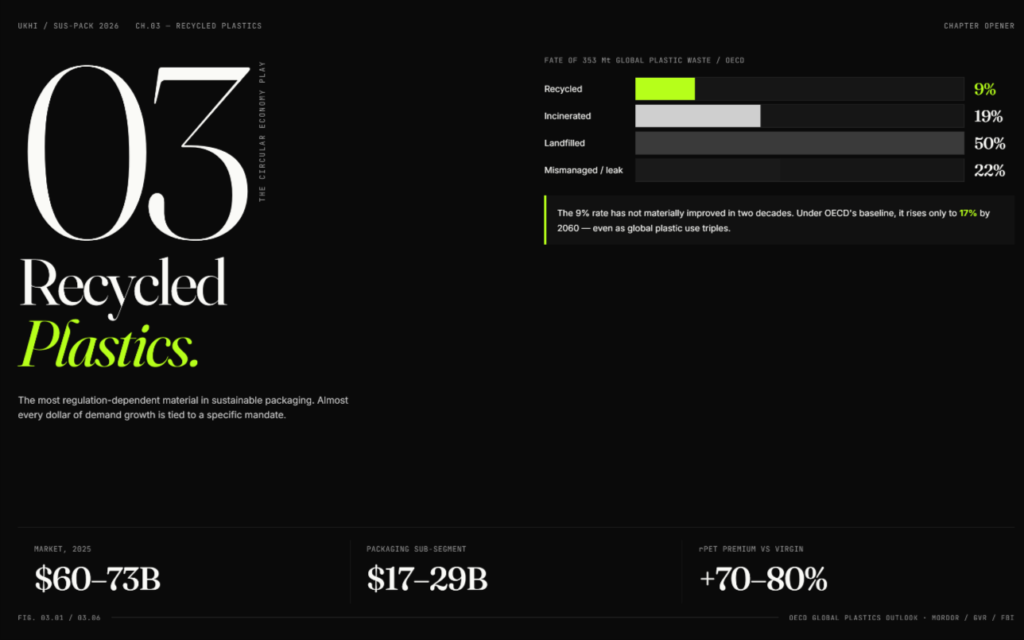
5.1 What Are Recycled Plastics?
Recycled plastics are conventional plastic resins (PET, HDPE, PP, and others) that have been recovered after consumer use, reprocessed, and converted back into usable material for new packaging or products.
The term post-consumer recycled content (PCR) refers specifically to plastic recovered after it has completed its first life with a consumer.
This is distinct from post-industrial recycled (PIR) material, which is factory off-cuts and converter scrap.
Every major regulatory framework (the EU PPWR, the UK Plastic Packaging Tax, India’s Plastic Waste Management Rules, and US state-level laws) counts PCR rather than PIR for compliance purposes.
Despite decades of effort and public messaging, the global plastic recycling rate remains stubbornly low.
The OECD’s Global Plastics Outlook found that of 353 million tonnes of plastic waste generated globally, only about 9% was actually recycled.
Roughly 19% was incinerated, 50% was landfilled, and 22% was mismanaged or leaked into the environment.
This figure has not materially improved in two decades.
Mechanical Recycling vs Chemical Recycling
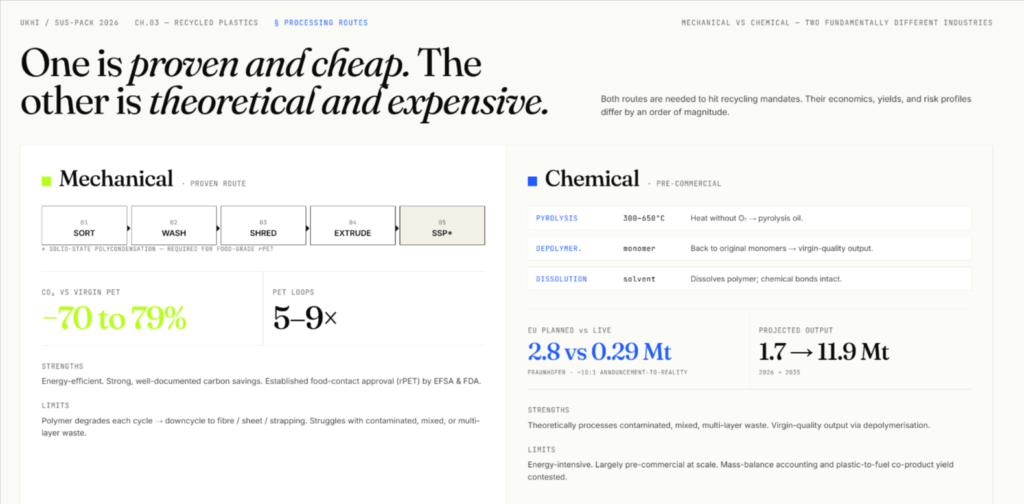
The recycled plastics industry runs on two fundamentally different processing routes:
Mechanical recycling
This is the established, proven route. Collected plastic is:
- sorted (using near-infrared optical sorters),
- washed in caustic solution at around 85°C,
- shredded into flakes, and
- melt-extruded into pellets.
For food-grade rPET, an additional solid-state polycondensation (SSP) step at approximately 210°C under vacuum is required to remove volatile contaminants and rebuild molecular weight.
Mechanical recycling is energy-efficient and delivers 70–79% lower CO₂ emissions than virgin PET production (as documented across multiple peer-reviewed life-cycle assessments).
Its limitation is that each cycle degrades the polymer. For instance, PET can typically withstand 5–9 mechanical recycling loops before quality drops below bottle-grade specification, at which point it is downcycled to fiber, sheet, or strapping.
Chemical recycling
This process breaks plastic below the polymer level.
The three main routes are:
- pyrolysis (heating at 300–650°C without oxygen to produce pyrolysis oil),
- depolymerisation (breaking polymers back to their original monomers, enabling virgin-quality output), and
- dissolution (dissolving the polymer in solvent without breaking chemical bonds).
Chemical recycling can theoretically process contaminated, mixed, and multi-layer waste that mechanical recycling cannot handle. However, it is significantly more energy-intensive, remains largely pre-commercial at scale, and its environmental credentials are contested.
Key Distinction — Mechanical vs Chemical Recycling
Mechanical recycling is proven, cost-effective, and delivers strong carbon savings, but it degrades polymer quality over multiple cycles and struggles with contaminated or mixed waste.
Chemical recycling can theoretically produce virgin-quality output from difficult waste streams, but it is far more energy-intensive, commercially unproven at scale, and faces serious questions about actual plastic-to-plastic yield versus fuel co-products.
5.2 Types of Recycled Plastics
5.2.1 rPET (recycled PET)
The most established recycled plastic.
PET bottles are the easiest packaging format to recycle because they are widely collected, easy to sort, and can be decontaminated to food-grade standards through the SSP process.
rPET is essentially the only widely approved food-contact recycled plastic, because PET’s crystal structure allows volatile contaminants to be driven off effectively. Both EFSA (EU) and the FDA (US) have approved numerous rPET processes for direct food contact.
5.2.2 rHDPE (recycled HDPE)
Used primarily in household product containers, detergent bottles, and non-food packaging. HDPE is mechanically recyclable but achieving food-contact approval is much harder than for PET because polyolefin matrices absorb low-volatility contaminants more readily.
5.2.3 rPP (recycled polypropylene)
PP is the second most commonly used packaging plastic, but recycling infrastructure is less developed than for PET or HDPE.
PureCycle Technologies, a US-based company that raised over USD 1.3 billion before struggling with operational delays at its Ohio plant, uses a proprietary dissolution process to produce near-virgin-quality rPP by stripping out colour, odour, and contaminants without breaking the polymer chain.
Separately, HolyGrail 2030 — an industry consortium led by AIM (the European Brands Association) with over 160 member companies — is using digital watermark technology to improve sorting accuracy for PP packaging, with the goal of achieving EFSA food-contact approval for mechanically recycled PP.
5.2.4 Chemical recycling output
Chemical recycling produces pyrolysis oils or depolymerised monomers as its output. These can be fed back into petrochemical steam crackers or polymerisation processes to produce packaging-grade resins that are chemically identical to virgin material. Because chemically recycled feedstock is typically co-processed alongside virgin naphtha in the same cracker, the recycled and virgin molecules cannot be physically separated in the final product. This is why the industry uses mass balance accounting to track recycled content: the recycled input is allocated to specific output products on a bookkeeping basis, verified by third-party certification schemes such as ISCC PLUS, rather than physically traced through each molecule.
5.3 Recycled Plastics Market Size and Growth
The global recycled plastics market size is estimated at USD 60–73 billion in 2025, with the range reflecting differences across research firms as to what they consider in scope of analysis.
Recycled Plastics Market Size Estimates by Research Firm
| Research Firm | 2025 Size (USD) | Forecast | CAGR |
|---|---|---|---|
| Mordor Intelligence | $72.7B | $103.6B by 2030 | 7.4% |
| Grand View Research | $60.8B | $132.3B by 2033 | 10.4% |
| Fortune Business Insights | $60.2B | $126.3B by 2034 | 8.6% |
| Market Research Future | — | $131.5B by 2035 | 8.7% |
The recycled plastics packaging market specifically was estimated at approximately USD 17–29 billion in 2025.
Fortune Business Insights puts it at USD 17.5 billion, growing to USD 25.9 billion by 2032 at 5.8% CAGR).
Within this, rPET is the largest segment at an estimated USD 12–19 billion, with bottle-to-bottle rPET at USD 2.7–6.6 billion.
The chemical recycling market is sized at USD 9–18 billion in 2025, with output projected to rise from 1.7 million tonnes in 2026 to 11.9 million tonnes by 2035.
Stat — The Scale Gap
Despite growing market value, the actual volume of plastic recycled globally remains small. Only about 33 million tonnes of the 353 million tonnes of plastic waste generated annually is recycled. The recycling rate for plastic has hovered around 9% globally for two decades. Under the OECD’s baseline scenario, it rises only to 17% by 2060 even as global plastic use triples.
5.4 Geographic Hotspots for Recycled Plastics
Europe — Regulatory Leader, Capacity Under Pressure
Europe leads on recycled plastics regulation but is experiencing a paradox: the most ambitious mandates in the world are coinciding with the first-ever contraction of its mechanical recycling industry.
Eurostat data (2023) shows the EU recycled 42.1% of plastic packaging waste, with Belgium (59.5%), Latvia (59.2%), and Germany (52.2%) leading.
However, Plastics Recyclers Europe reported that:
- installed recycling capacity fell to 13.5 million tonnes in 2024,
- recyclate output dropped from 7.7 to 7.5 million tonnes, and
- roughly 300,000 tonnes of capacity closed — the largest single-year decline ever.
The cause: cheap virgin plastic imports from new Asian petrochemical capacity, high European energy costs, and rPET commanding an approximately 70–80% premium over virgin PET in mid-2025.
North America — Low Collection, Big Chemical Recycling Bets
The US plastic recycling rate is officially 8.7% (EPA, 2018 data), although independent estimates put the current figure at 5–6%.
PET bottle recycling reached 33% in 2023, which was the highest since 1996 but still well below European leaders.
The Recycling Partnership found that 83% of curbside-recyclable plastic packaging is not placed in recycling bins, and 40 million US households lack equitable recycling access.
Chemical recycling investment is concentrated in Texas (ExxonMobil Baytown), Tennessee (Eastman Kingsport, operational at 110,000 tonnes per year), and Ohio (PureCycle).
The EPA estimates USD 36.5–43.4 billion is needed by 2030 to modernise US recycling infrastructure.
India — High Collection, Formalization Challenge
India’s recycled plastics market is estimated at approximately USD 2.2 billion (TechSci Research, 2024), growing at 10.8% CAGR.
India has one of the world’s highest PET bottle collection rates at 90–95%, driven by an informal sector of roughly 1.5–4 million waste pickers and aggregators.
The country generates approximately 9.3 million tonnes of plastic waste annually and recycles about 60% of it, though much of this is downcycled to fiber or sheet rather than returned to packaging.
Major recyclers include:
- Ganesha Ecosphere (recycling over 20% of India’s PET bottle waste),
- JB Ecotex (118,800 tonnes per year consolidated capacity), and
- Banyan Nation (formalised informal-sector HDPE/PP collection supplying Hindustan Unilever and L’Oréal).
Asia-Pacific Highlights
Japan recycles 85.1% of PET bottles (FY2024) with a 98.6% collection rate, which is among the highest in the world, achieved without a deposit-return scheme. South Korea recycles 79% of PET bottles and from January 2026 mandates 10% rPET in bottles for large producers, rising to 30% by 2030.
5.5 Key Applications for Recycled Plastics Packaging
Beverage bottles are the primary application, and the bottle-to-bottle rPET loop is the most commercially mature example of true closed-loop recycling in the plastics industry. However, brand performance against recycled content targets has been mixed.
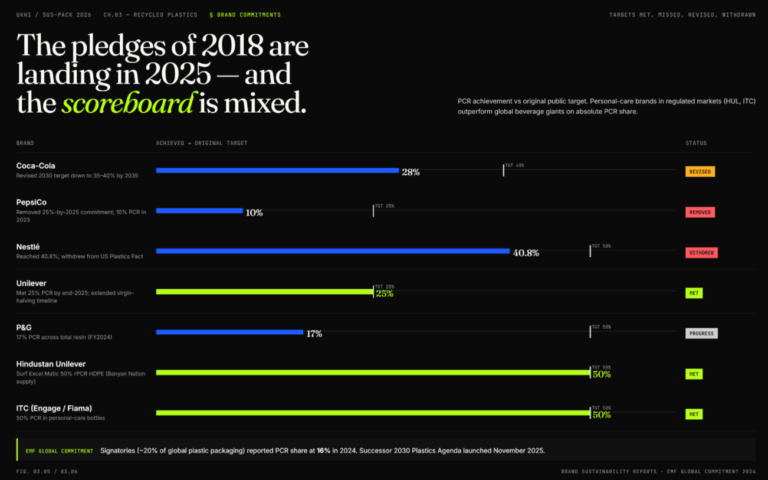
Coca-Cola achieved 28% recycled material in 2024 but revised its 2030 target downward to 35–40% by 2035.
PepsiCo reached 10% PCR in 2023, up from 7% in 2022, but removed its 25%-by-2025 commitment.
Nestlé reached 40.8% recycled content but withdrew from the US Plastics Pact.
Unilever met its 25% PCR target by end-2025 but extended its virgin-plastic-halving timeline.
Personal care and household chemicals are scaling recycled content faster than many food applications because food-contact regulatory barriers do not apply.
Hindustan Unilever’s Surf Excel Matic uses 50% rPCR HDPE supplied by Banyan Nation.
ITC’s Engage and Fiama bottles use 50% PCR. P&G reported 17% PCR across total resin in FY2024.
Textiles and fiber represent the largest single end market for rPET globally, potentially larger than bottle-to-bottle by volume.
Recycled PET fiber delivers 30–50% carbon footprint reduction versus virgin polyester.
However, once PET enters blended garments, textile-to-textile recycling captures less than 1% of fiber supply, meaning the material is effectively lost from the packaging loop.
5.6 Regulatory Mandates and Infrastructure for Recycled Packaging
Regulation is the defining force behind recycled plastics demand.
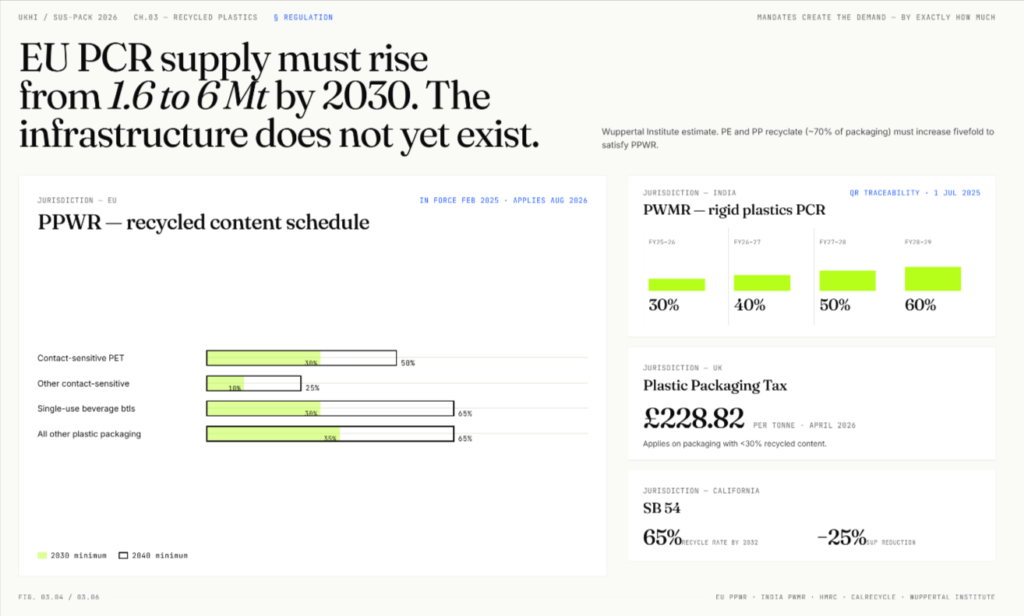
The EU PPWR, which entered into force in February 2025 and applies from August 2026, sets the most detailed mandatory recycled content schedule in any jurisdiction:
- Contact-sensitive PET packaging: 30% recycled content by 2030, rising to 50% by 2040
- Contact-sensitive non-PET plastic packaging: 10% by 2030, rising to 25% by 2040
- Single-use plastic beverage bottles: 30% by 2030, rising to 65% by 2040
- All other plastic packaging: 35% by 2030, rising to 65% by 2040
The UK Plastic Packaging Tax applies at £228.82 per tonne (from April 2026) on packaging with less than 30% recycled content.
India’s Plastic Waste Management Rules establish the most aggressive PCR schedule in any major economy.
Rigid plastics must contain 30% recycled content from FY 2025–26, rising to 40% (2026–27), 50% (2027–28), and 60% by 2028–29.
Mandatory QR-code traceability took effect 1 July 2025.
California SB 54 mandates a 65% recycling rate for plastics by 2032 and a 25% reduction in single-use plastic, though implementation has slipped (CalRecycle withdrew proposed regulations in January 2026 for revision). Seven US states now have packaging EPR laws.
Insight — The Infrastructure Gap
The Wuppertal Institute estimates that:
- EU PCR plastic supply must rise from approximately 1.6 to 6 million tonnes by 2030 (a near-fourfold increase) to satisfy PPWR targets.
- PE and PP recyclate, which together represent about 70% of packaging, must increase fivefold.
- In chemical recycling, the Fraunhofer Institute’s map shows 2.8 million tonnes per year of planned European capacity against just 0.29 million tonnes operational, a roughly tenfold announcement-to-reality ratio.
The infrastructure required to meet these mandates does not yet exist.
5.7 Recycled Plastics Market Drivers and Challenges
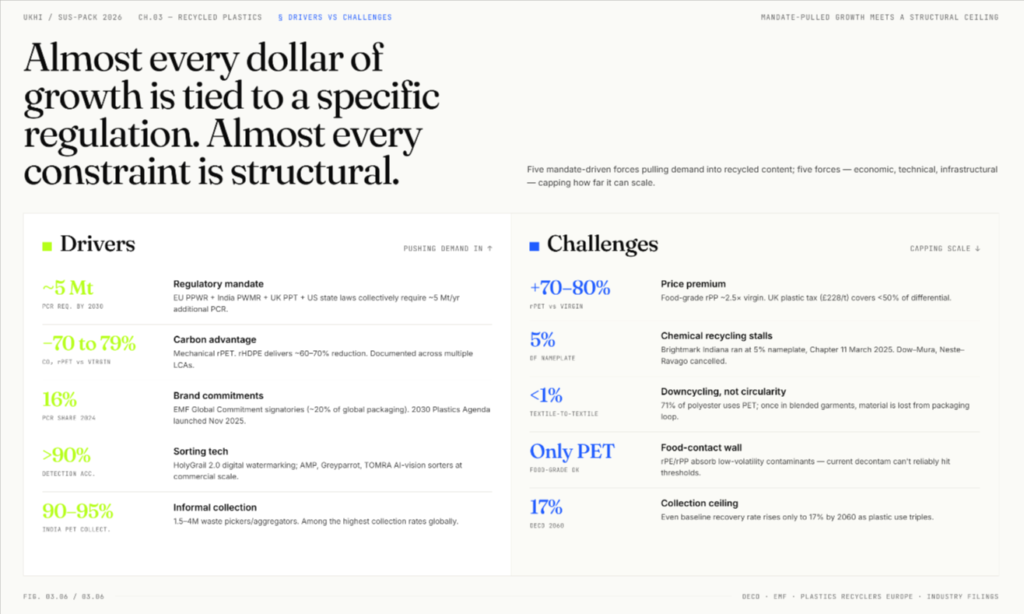
5.7.1 Growth Drivers for Recycled Plastics
Regulatory mandates are creating guaranteed demand. The EU PPWR, India’s PWMR, the UK plastic tax, and US state laws collectively require roughly 5 million tonnes per year of additional recycled content by 2030.
Carbon footprint advantages are substantial and well-documented. Mechanical rPET delivers 70–79% lower CO₂ emissions than virgin PET. rHDPE delivers approximately 60–70% reduction.
Brand commitments continue to drive procurement, even where timelines have slipped. The Ellen MacArthur Foundation’s Global Commitment signatories (representing roughly 20% of global plastic packaging) reported PCR share reaching 16% in 2024, with a successor 2030 Plastics Agenda launched in November 2025.
Sorting technology is advancing rapidly. The HolyGrail 2.0 digital watermarking programme completed industrial trials in Germany with detection accuracy consistently above 90% across 5,949 unique product codes. AI-vision sorters from AMP Robotics, Greyparrot, and TOMRA are deploying at commercial scale.
5.7.2 Challenges and Limitations of Recycled Plastics
The rPET price premium over virgin PET reached approximately 70–80% in mid-2025, and food-grade rPP commands roughly 2.5 times the price of virgin. The UK plastic tax (£228 per tonne) covers less than half this differential, meaning recycled content is still more expensive than paying the tax in many applications.
Chemical recycling is not delivering at scale. Multiple flagship projects have been cancelled or delayed in 2024–2025, including Dow–Mura in Germany, Neste–Ravago in the Netherlands, and Brightmark’s Indiana facility (which filed for bankruptcy in March 2025 after operating at 5% of rated capacity). Eastman’s Kingsport plant is the notable exception, operating at approximately 105% of nameplate capacity.
Collection rate ceilings are real. Even in high-performing countries, the easy waste streams (clear PET bottles, HDPE containers) are largely saturated. Films, sachets, and multi-layer packaging (the categories most in need of recycling solutions) remain extremely difficult and expensive to recycle mechanically.
Food-grade limitations constrain non-PET recycled plastics. rPET is essentially the only widely approved food-contact recycled plastic. PE and PP absorb low-volatility contaminants that current decontamination technology cannot reliably remove to regulatory thresholds, limiting food-grade recycled content options for the majority of packaging formats.
Downcycling rather than true circularity remains the norm for much recycled plastic. PET bottles recycled into polyester fiber (roughly 71% of polyester uses PET) are functionally lost from the packaging loop, since textile-to-textile recycling captures less than 1% of fiber supply.
Virgin plastic remains structurally cheap. New petrochemical capacity in Asia and the Middle East continues to push virgin resin prices down, widening the cost gap with recycled content despite regulatory intervention.
The Bottom Line
Recycled plastics are the most regulation-dependent material in sustainable packaging. Almost every dollar of demand growth is tied to a specific mandate.
The carbon-footprint case for mechanical recycling is strong, but the economics are challenging and chemical recycling remains years away from commercial proof at scale.
For packaging categories where recycling infrastructure is strong and food-contact approval exists, recycled content is a proven and scalable solution. For flexible packaging, multi-layer structures, and food-contact applications beyond PET, the recycling system cannot yet close the loop, which is where alternative materials, including compostable bioplastics, have an opening.
6. Molded Fiber & Pulp Packaging: Market Size, Materials, and Global Growth
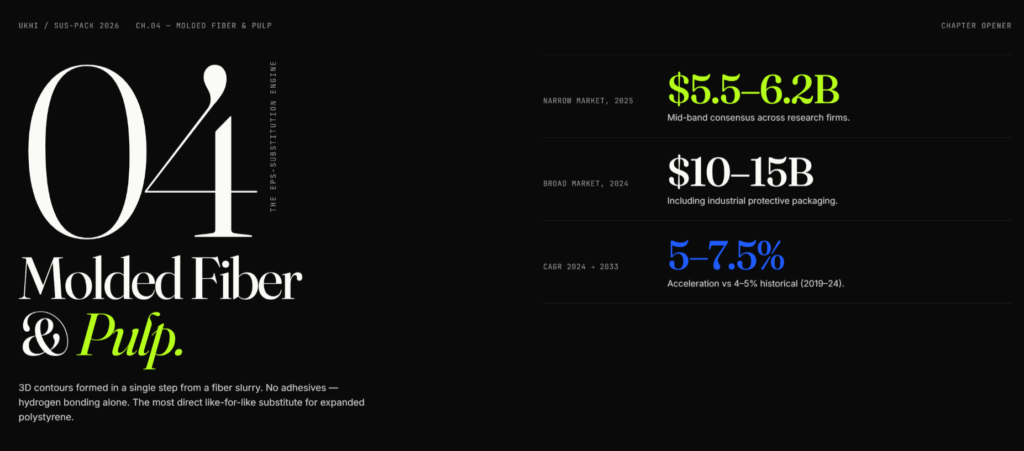
6.1 What Is Molded Fiber Packaging?
Molded fiber packaging (also called molded pulp packaging) is a three-dimensional packaging material made by depositing cellulose fibers from a water-based slurry onto a shaped porous mold, then dewatering and drying it into a rigid, self-bonded part.
No synthetic adhesives are required.
The fibers bond through hydrogen bonding alone, which is why uncoated molded fiber parts are naturally recyclable in standard paper streams, home- or industrially compostable, and biodegradable in most managed environments.
The defining characteristic that separates molded fiber from paper bags or folding cartons is its capacity to form complex three-dimensional contours in a single step (trays, clamshells, cushioned inserts, and cups) without die-cutting or gluing flat sheets.
That structural property makes it the most direct like-for-like substitute for expanded polystyrene (EPS), and it is this substitution dynamic that is driving the category’s current growth.
Definition
The International Molded Fiber Association (IMFA) classifies molded fiber products into four types based on wall thickness and process:
- Type 1 (thick-wall, 5–10 mm, industrial),
- Type 2 (transfer-molded, 3–5 mm, egg and produce trays),
- Type 3 (thermoformed, 2–4 mm, smooth-finish electronics and foodservice), and
- Type 4 (processed, under 2 mm, cosmetics and high-end retail).
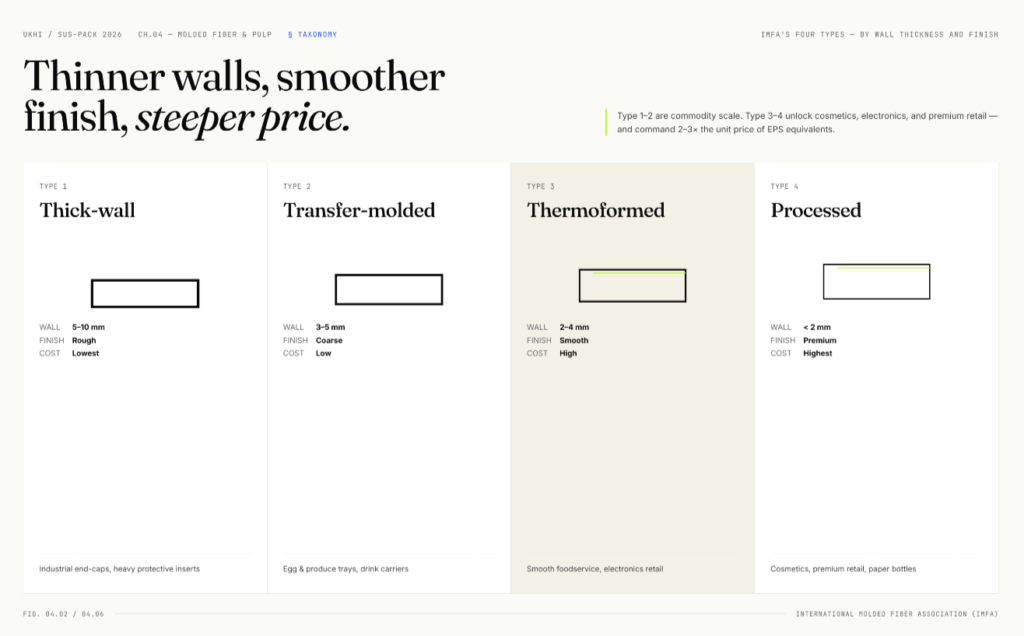
6.2 Types of Molded Fiber: Materials and Formats
6.2.1 By Feedstock
The types of molded fiber packaging vary significantly by raw material input, and the choice of feedstock affects cost, performance, availability, and end-of-life credentials.
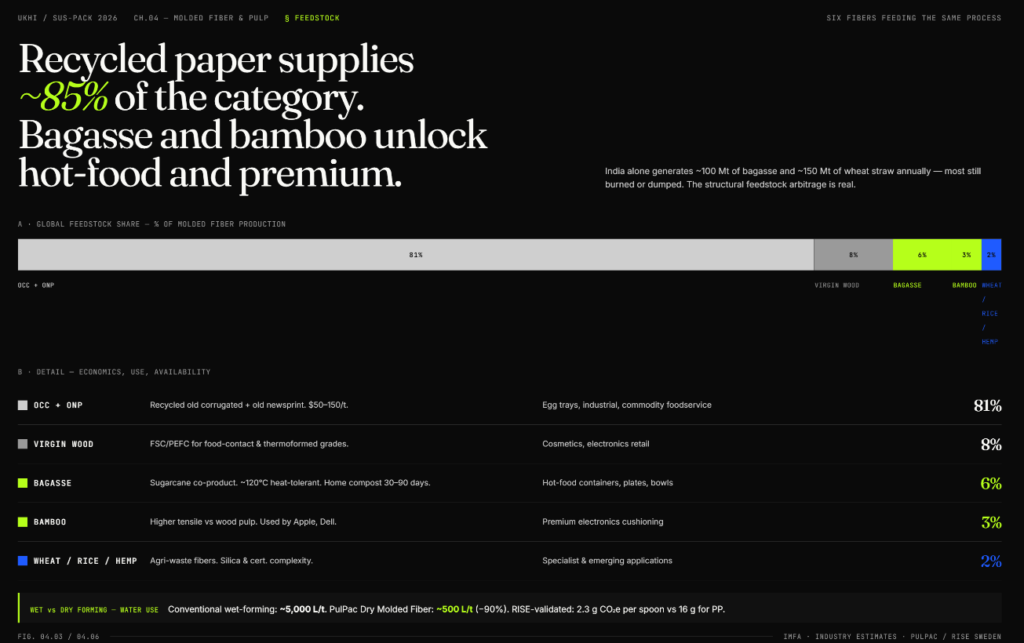
Recycled OCC (old corrugated containers) and old newsprint — the dominant feedstock globally, supplying roughly 81–88% of all molded fiber production. Low-cost (USD 50–150/tonne), widely available, and structurally proven. Standard for egg trays, industrial end-caps, and commodity foodservice.
Virgin wood pulp — used where food-contact certification demands cleaner inputs, and in thermoformed grades where surface finish and consistency matter. Higher cost, but supports FSC and PEFC supply chain claims.
Sugarcane bagasse — the fibrous residue from sugarcane processing. Naturally available in India, Brazil, Thailand, and Southeast Asia at near-zero raw material cost (a co-product of sugar milling). Naturally heat-resistant up to ~120°C and suitable for hot-food containers without additional treatment. Bagasse is home compostable within 30–90 days in soil. India produces approximately 100 million tonnes of bagasse annually, making it one of the world’s most abundant agri-fiber feedstocks.
Bamboo fiber — fast-growing, FSC-certifiable, with naturally higher tensile strength than wood pulp. Used by Apple in Beats Studio Pro and Vision Pro packaging; deployed by Dell in notebook cushioning.
Wheat straw and rice husk — agricultural waste fibers well-suited to India’s Punjab and Haryana farming belt and to U.S. Pacific Northwest producers (e.g., Palouse Fiber, Washington). Silica content in rice husk requires preprocessing, limiting scale-up outside specialist converters.
Hemp fiber — high strength-to-weight ratio and rapid renewability, but supply chain remains fragmented and food-contact certification pathways are still developing in most markets.
6.2.2 By Production Process
The difference between wet-formed and dry-formed molded fiber matters commercially as well as technically.
Wet-forming is the conventional process. Fiber is slurried in water (around 99% water, 1% fiber), deposited on the mold, and the water is drained and evaporated.
It is proven at scale and accounts for the vast majority of global capacity.
The drawback is resource intensity, at approximately 5,000 litres of water and 50 kWh per tonne of product.
Dry Molded Fiber (DMF), developed by PulPac (Sweden), eliminates the water slurry.
Dry fibers are air-laid on the mold and bonded under heat and pressure in cycle times of approximately 3.5 seconds.
The process uses roughly 500 litres of water per tonne (a ~90% reduction) and lifecycle assessments validated by RISE Research Institutes of Sweden show 2.3 g CO₂e per cutlery spoon versus 16 g for polypropylene.
6.2.3 Molded Fiber Packaging Market Size and Growth
Global Market Size
The molded fiber packaging market size is contested between research firms primarily because they define scope differently.
Narrow definitions cover only food-contact trays, plates, and egg cartons, while broad definitions include all fiber-based protective packaging for electronics and industrial use.
Molded Fiber and Molded Pulp Packaging Market Size Estimates, 2025
| Research Firm | Scope | 2024/2025 Size (USD B) | Forecast | CAGR |
|---|---|---|---|---|
| Mordor Intelligence (molded pulp) | Narrow | USD 5.47B (2025) | USD 7.04B by 2030 | 5.2% |
| Grand View Research (molded pulp) | Narrow | USD 6.21B (2025) | USD 10.18B by 2033 | 6.3% |
| Fortune Business Insights | Narrow | USD 5.78B (2025) | USD 11.01B by 2034 | 7.5% |
| IMARC Group | Narrow | USD 5.50B (2024) | USD 8.90B by 2033 | 5.0% |
| Mordor Intelligence (molded fiber) | Broad | USD 14.84B (2024) | USD 19.57B by 2030 | 4.7% |
| Future Market Insights | Broad | USD 10.22B (2024) | USD 20.64B by 2035 | 6.8% |
| Market Research Future | Broad | USD 11.14B (2025) | USD 19.69B by 2035 | 5.3% |
| Smithers (primary research) | Narrow | USD 4.29B (2023) | USD 5.64B by 2028 | 5.7% |
On the narrow, food-and-consumer-packaging definition, the market mid-band sits at USD 5.5–6.2 billion in 2025, growing at 5–7.5% CAGR toward USD 9–11 billion by 2033.
The historical 2019–2024 CAGR was approximately 4–5%; the acceleration to 5.5–7.5% post-2024 reflects the compounding effect of regulatory mandates removing EPS and PFAS-coated plastics simultaneously.
Stat
The molded fiber egg carton sub-market alone was valued at USD 2.28 billion in 2024 (Market Research Future), and the bagasse tableware sub-segment is forecast to grow at 7.5% CAGR from USD 3.1 billion in 2026 to USD 6.4 billion by 2036 (Future Market Insights).
6.4 Geographic Hotspots: Molded Fiber Markets by Region
Asia-Pacific — Volume Leader and Production Hub
Asia-Pacific holds 38–47% of the global molded fiber market and is growing at 5.6–6.8% CAGR.
China is the largest single country market, estimated at USD 792 million in 2024, with major production clusters in Hangzhou, Guangdong, and Guangxi.
Key Chinese producers include Hangzhou Key II, Shanghai Huain, Guangxi Qiaowang, and HGHY.
India deserves separate treatment as the most strategically important emerging market in the category.
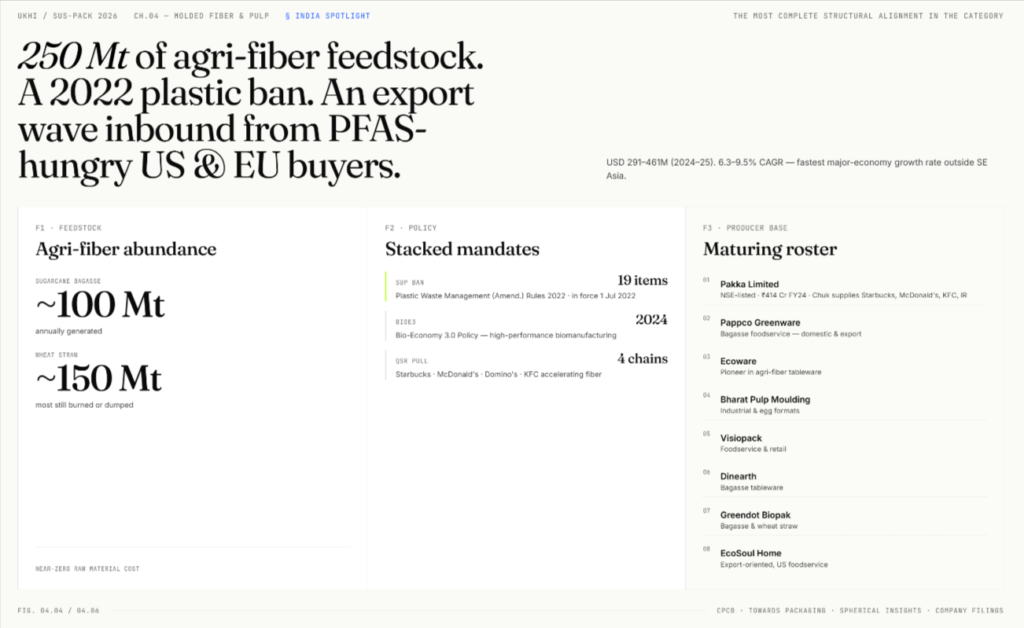
India molded pulp packaging market size: USD 291–461 million in 2024/2025, depending on scope (Towards Packaging, Spherical Insights).
India molded fiber market CAGR: 6.3–9.5% (2025–2035), the fastest major-economy growth rate outside Southeast Asia.
Demand drivers: the Plastic Waste Management (Amendment) Rules 2022, which banned 19 single-use plastic items from 1 July 2022; the BioE3 Policy 2024; rapid e-commerce growth; and QSR expansion (Starbucks, McDonald’s, Domino’s, KFC).
India’s feedstock advantage is immense — ~100 million tonnes of sugarcane bagasse and ~150 million tonnes of wheat straw generated annually, but most of it is still burned or dumped.
Key Indian producers:
- Pakka Limited (NSE-listed; FY24 revenue ₹414 crore; Chuk brand supplies Starbucks, McDonald’s, KFC, Indian Railways),
- Pappco Greenware,
- Ecoware,
- Bharat Pulp Moulding,
- Visiopack,
- Dinearth,
- Greendot Biopak, and
- EcoSoul Home.
Europe — Regulatory Engine
Europe holds approximately 25% of the global molded fiber market, with the strongest near-term regulatory tailwinds of any region.
The EU Packaging and Packaging Waste Regulation (PPWR) (in force from 11 February 2025, applying from August 2026) sets all-packaging recyclability requirements by 2030 and restricts PFAS in food-contact materials to 25 ppb.
The EU Single-Use Plastics Directive has already removed EPS cups, plates, and food containers from the on-premises foodservice market across all 27 member states.
Key European producers:
- Brødrene Hartmann (Denmark; 14 billion molded fiber egg cartons annually; acquired Dentaş Romania in April 2025),
- Huhtamaki (Finland; 12 billion-plus egg trays from 78 plants globally; stepped up smooth molded fiber production for European foodservice in 2024),
- PulPac,
- Pulp-Tec,
- CDL Omni-Pac, and
- Stora Enso.
North America — The EPS Substitution Runway
The North American molded fiber packaging market reached approximately USD 1.1 billion in 2024.
Twelve U.S. state-level EPS foodware bans are now in force: California SB 54, New York, New Jersey, Colorado, Washington, Oregon, Maine, Vermont, Maryland, Rhode Island, Delaware, and Virginia.
North America alone consumes 3.6 billion egg cartons annually, with roughly half still in EPS, indicating substantial unconverted demand.
Key North American producers:
- Pactiv Evergreen,
- UFP Technologies,
- Sabert,
- Genpak (acquired Harvest Fiber in January 2024),
- Henry Molded Products,
- Western Pulp, and
- Huhtamaki North America (USD 100 million expansion at Hammond, Indiana).
Latin America — The Bagasse Supply Base
Brazil produces approximately 40% of the world’s sugarcane. Pakka Limited’s 400-tonne-per-day Guatemala plant is being designed to serve U.S. import demand for PFAS-free bagasse packaging, illustrating the structural trade corridor emerging between tropical-fiber producers and North American buyers.
6.5 Key Applications and End-Use Sectors for Molded Fiber Packaging
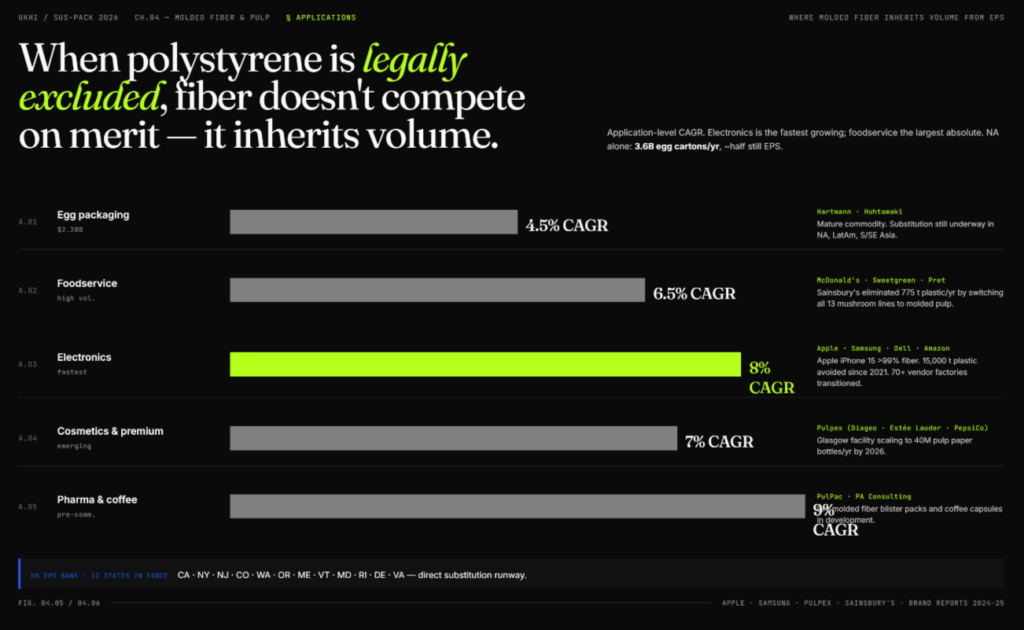
Egg Packaging — The Historical Anchor
Egg cartons remain the largest single application segment, with the global molded fiber egg carton market valued at USD 2.28 billion in 2024. Hartmann and Huhtamaki dominate globally. The format is effectively a mature commodity, but EPS-to-fiber conversion within egg cartons is still underway in parts of North America, Latin America, and South and Southeast Asia.
Foodservice — The High-Volume Growth Segment
Clamshells, plates, bowls, and hot-food trays represent the fastest-growing large application.
McDonald’s has committed to 100% certified, recycled, or renewable primary guest packaging by end-2025.
Sweetgreen, Pret A Manger, and major UK supermarkets have accelerated fiber foodservice adoption.
A concrete example of the switching scale: Sainsbury’s eliminated 775 tonnes of plastic per year in January 2024 by switching all 13 own-label mushroom lines to molded pulp punnets.
Electronics Protective Packaging — Fastest CAGR at 7–9%
The electronics molded fiber packaging segment is growing faster than any other application, driven by brand-level commitments from the largest consumer electronics companies in the world.
Apple transitioned iPhone 15 packaging to >99% fiber and Apple Watch Series 9 to 100% fiber. The program has avoided more than 15,000 tonnes of plastic across the supply chain since 2021, with over 70 vendor factories transitioned.
Samsung moved Galaxy S24 and S25 to recycled molded pulp trays, reducing plastic in mobile packaging from 51% of materials (2017) to near-zero (2025).
Amazon’s Frustration-Free Packaging program now covers more than 750,000 SKUs (up from 19 in 2008), with fiber cushioning replacing plastic air pillows globally in 2024.
Dell uses bamboo-fiber cushioning in approximately 70% of its notebooks.
Cosmetics and Personal Care — The Premium Thermoformed Opportunity
Processed and thermoformed molded fiber is entering cosmetics as brands seek plastic-free secondary packaging with tactile and visual quality.
The Pulpex consortium — which includes Diageo, Estée Lauder, Unilever, PepsiCo, GSK, and Castrol — is scaling its Glasgow facility to 40 million pulp-molded paper bottles annually by 2026.
Individual brand case studies include Estée Lauder’s Pulpex bottle, Diageo’s Johnnie Walker paper whisky bottle, and a growing range of primary cosmetics fiber packaging from James Cropper and GPA Global.
Emerging Applications
PulPac, in partnership with PA Consulting, is developing dry molded fiber coffee capsules and pharmaceutical blister-pack alternatives.
The latter is of direct relevance to the multi-hundred-billion-unit global pharma packaging market.
Frugalpac’s paper wine bottle, made from recycled paperboard with a thin inner liner, is now stocked in over 1,200 Target stores in the United States.
6.6 Market Drivers and Challenges for Molded Fiber Packaging
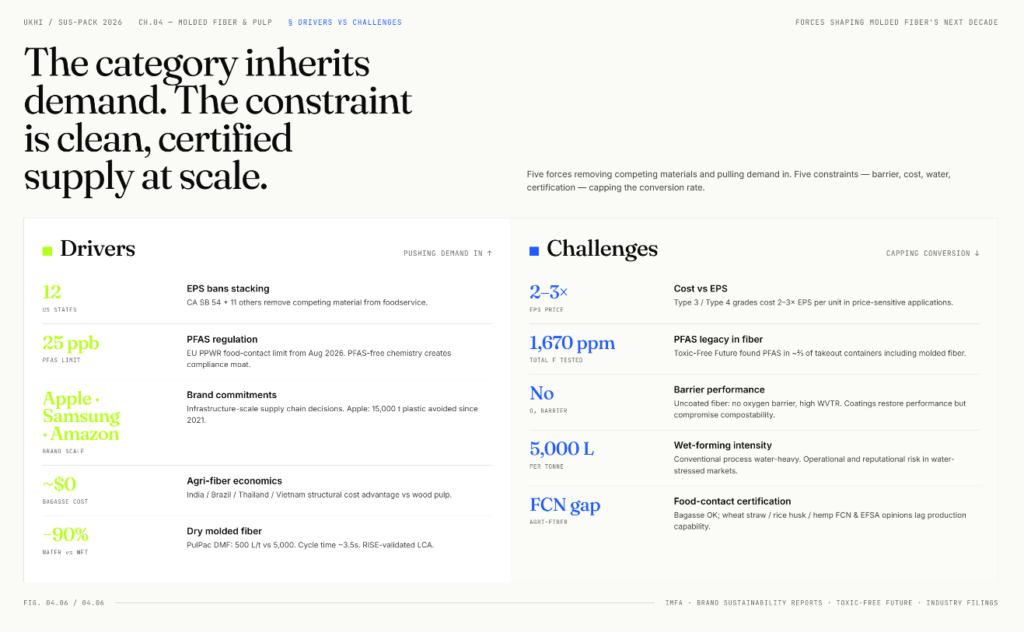
6.6.1 Growth Drivers for Molded Fiber Packaging
Regulatory mandates are the primary driver, and they are stacking.
The EU SUP Directive, PPWR, India’s single-use plastic ban, and twelve U.S. state EPS bans are forces of legal removal of competing materials from specific applications.
Each ban creates a direct substitution opportunity for molded fiber.
PFAS regulation is a secondary but accelerating driver.
Molded fiber coated with PFAS was itself a problem product; the shift to PFAS-free barrier chemistry (starch, shellac, chitosan, and commercial products such as Solenis ContourSM) is simultaneously cleaning up molded fiber’s credentials and eliminating the PFAS-coated plastic competition.
Brand commitments at Apple, Samsung, Amazon, McDonald’s, IKEA, and Nestlé are translating into durable volume contracts.
These are infrastructure-scale supply chain decisions.
Consumer preference consistently favors tactile, natural-looking packaging.
Molded fiber scores strongly on perceived sustainability in consumer research, particularly for food and personal care, where the unbleached texture signals compostability credibly.
Agri-fiber feedstock economics in India, Brazil, Thailand, and Vietnam give emerging-market producers a structural cost advantage over wood-pulp-based European and North American producers, provided food-contact certification is achieved.
6.6.2 Challenges and Limitations of Molded Fiber Packaging
Barrier performance remains the most fundamental technical constraint.
Uncoated molded fiber has no meaningful oxygen barrier and high water vapor transmission, ruling it out for moisture-sensitive foods, oxygen-sensitive snacks, or carbonated beverages without functional coatings.
The coatings that restore performance can compromise compostability.
PFAS in molded fiber foodservice has been a reputational and regulatory problem for the category itself.
Testing by Toxic-Free Future found fluorine in approximately two-thirds of sampled takeout containers, including molded fiber products, with Sweetgreen bowls averaging 1,670 ppm total fluorine.
At least 16 U.S. states now have PFAS bans for food packaging in force, and the EU PPWR’s 25 ppb limit applies from August 2026.
The industry is transitioning, but not all producers have completed the switch.
Cost versus EPS remains a barrier in price-sensitive applications.
Thermoformed Type 3 and Type 4 grades cost 2–3× the EPS equivalent per unit.
Standard thick-wall grades are closer to cost parity, but the premium grades that enable electronics and cosmetics use are still meaningfully more expensive.
Water and energy intensity of wet-forming processes is real.
A conventional molded pulp facility uses approximately 5,000 litres of water per tonne.
In water-stressed markets and under tightening industrial ESG reporting, this creates both operational cost exposure and reputational risk, which is one reason the dry molded fiber transition is commercially significant beyond just cycle time.
Food-contact certification for agri-fiber grades remains inconsistent across markets.
Bagasse packaging certified to EN 13432 or BPI compostability standards is commercially established, but FDA food contact notification (FCN) and EFSA opinions for specific wheat straw, rice husk, and hemp formulations lag behind production capability.
This slows export market access for Indian and Southeast Asian agri-fiber producers.
Insight — The PFAS Pivot
The PFAS issue in molded fiber is a short-term liability and a medium-term opportunity. Producers who transition to certified PFAS-free barrier chemistry before regulatory deadlines will hold a meaningful compliance advantage in the EU and U.S. markets post-2026. This is creating a competitive divide between vertically integrated producers with in-house chemistry capability and smaller converters dependent on third-party coatings.
6.7 The Bottom Line on Molded Fiber
The molded fiber packaging market forecast points to 5–7.5% CAGR through 2033, but market growth rates understate the real shift.
Regulatory mandates are not making EPS less attractive; they are removing it from specific applications entirely.
When polystyrene is legally excluded from foodservice, electronics retail, and produce, molded fiber does not compete on merit: it inherits volume.
The constraint is clean, certified supply at scale.
For India in particular:
- the combination of 100 million tonnes of annual bagasse availability,
- an established but still-maturing domestic producer base,
- a growing export corridor to PFAS-free-hungry European and U.S. buyers, and
- accelerating domestic enforcement of the 2022 plastic ban
represents the most complete structural alignment of feedstock, regulation, and demand of any geography in the category. The question for Indian producers is whether the supply chain will be ready when the European and North American demand wave arrives.
7. Emerging and Next-Generation Packaging Materials: Market Size, Technologies, and Growth
7.1 What Are Next-Generation Packaging Materials?
The sustainable packaging market is dominated by materials that already operate at commercial scale.
These are namely paper, bioplastics, recycled plastics, and molded fiber.
But a significant share of conventional packaging cannot be adequately replaced by any of those established alternatives.
Some examples are high-performance flexible films, protective foams, single-serve sachets, and active food-preservation coatings.
Next-generation packaging materials are the emerging material systems that are working to close that gap.
They are at various stages of commercialization, from fully market-ready to pre-commercial pilot stage, and they share two characteristics:
- they are derived from biological or waste-stream feedstocks, and
- they target packaging applications where the existing sustainable options fall short.
This chapter covers the six material families that have moved furthest from laboratory to market: mycelium packaging, seaweed and algae-based packaging, agricultural waste composites, nanocellulose and cellulose film innovations, protein-based films, and chitosan and chitin packaging.
Note
Together, these materials have attracted more than USD 1 billion in disclosed venture capital between 2020 and 2025.
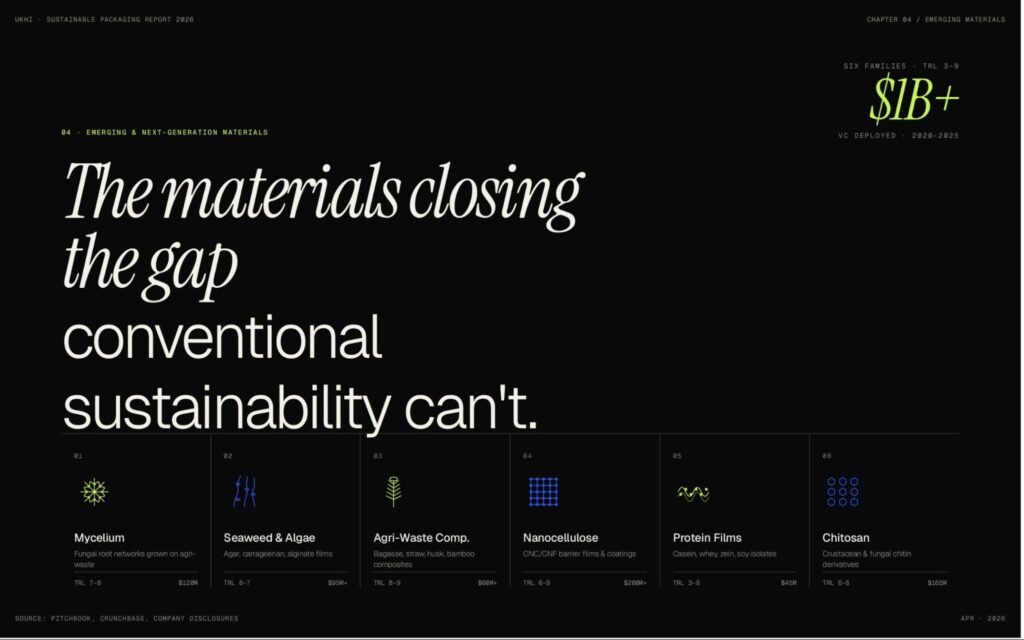
7.2 Types of Emerging Packaging Materials
7.2.1 Mycelium Packaging
Mycelium packaging is made by growing fungal root networks through agricultural waste substrates (hemp hurds, paddy straw, sugarcane bagasse) inside shaped moulds.
The result is heat-killed and dried into a rigid, lightweight foam that functions as a direct substitute for expanded polystyrene (EPS) in protective packaging.
Properties
Lightweight, shock-absorbing, home compostable in 30–45 days (TÜV OK Home Compost certified), no synthetic materials, no microplastic residue.
Key producers
- Ecovative Design (USA, approximately USD 120 million cumulative funding, targeting over one billion EPS replacements by 2032),
- Magical Mushroom Company (UK, four plants, clients include Lush and Diageo), and
- Grown.bio (Netherlands, scaling toward 10 million units annually).
India
- Dharaksha Ecosolutions (Faridabad) grows mycelium on Punjab paddy stubble and supplies V-Guard, Havells, and Kyari.
- Roha Biotech (Chennai, IIT Madras incubated) is scaling from 4 tonnes per month toward 4 tonnes per day.
Limitations
Grow cycles of 4–7 days constrain throughput compared to seconds for injection-moulded foam. Cost remains 2–4 times that of EPS, with parity forecast around 2027–2028 in key markets. Moisture sensitivity limits its use in humid or refrigerated logistics.
7.2.2 Seaweed and Algae-Based Packaging
Seaweed packaging uses agar, carrageenan, and alginate extracted from macro and microalgae to produce films, sachets, coatings, and rigid packaging.
Some of these formulations are even edible.
Others are home compostable within days or certified marine biodegradable, which makes seaweed the only packaging material category that can degrade safely in ocean environments.
Key producers
- Notpla (UK, USD 47.3 million cumulative funding, first material certified plastic-free under the EU Single-Use Plastics Directive, replaced 4.4 million plastic units in 2023 via Just Eat and Lucozade),
- Sway (USA, targeting scalable seaweed film to replace polybags),
- Kelpi (UK, clients include L’Oréal, Diageo, and Waitrose),
- Sea6 Energy (Bengaluru, USD 48.4 million raised, mechanised ocean farming platform), and
- Zerocircle (Mumbai, Tom Ford Plastic Innovation Challenge Grand Prize winner, supplies Swiggy with PFAS-free seaweed coatings).
The Indian government has committed INR 637 crore under the Pradhan Mantri Matsya Sampada Yojana for seaweed cultivation, targeting 1.12 million tonnes from a 2021 base of just 34,000 tonnes.
Limitations
Shelf life is limited without moisture barriers. Algae supply chains remain fragmented outside Asia. Regulatory pathways for food-contact certification (FDA, EFSA) are still incomplete for some formulations.
7.2.3 Agricultural Waste Composites
This category covers structural boards, panels, and foam substitutes made from bagasse, wheat straw, rice husk, bamboo, and corn husk as full composite materials, distinct from the wet-laid molded fiber products covered in the previous chapter.
Key producers
- PaperFoam (Netherlands, starch-and-cellulose injection-moulded foam used by T-Mobile and Veuve Clicquot),
- Pakka Ltd (NSE-listed, FY24 revenue INR 414 crore, doubling Ayodhya capacity with INR 550 crore investment), and
- Bambrew (Bengaluru, USD 20.2 million raised, exports bamboo-fiber packaging to 30+ countries).
India produces approximately 500 million tonnes of crop residue annually, of which around 87 million tonnes is burned in fields. Converting this waste into packaging feedstock addresses air quality, provides a cost advantage over virgin pulp, and aligns with policy pressure to end stubble burning.
7.2.4 Nanocellulose and Cellulose Film Innovations
Nanocellulose refers to cellulose nanocrystals (CNC) and cellulose nanofibers (CNF) derived from wood pulp through acid or mechanical processing.
When applied as coatings or dispersed in films, they create oxygen and moisture barriers comparable to EVOH or aluminium foil at lower weight and with full compostability.
Transparent cellulose films are the most commercially mature sub-category.
Futamura’s NatureFlex films are certified home compostable and already exempt from the EU Single-Use Plastics Directive, used in Nestlé Quality Street wraps and pharmaceutical blisters.
Key producers
- CelluForce (Canada, world’s largest CNC plant at 300 tonnes per year),
- Melodea (Israel, barrier coatings replacing EVOH and aluminium), and
- Sappi, Stora Enso, and Borregaard at commercial supply scale.
Cellulose film packaging market size: USD 3.8 billion in 2025, forecast to reach USD 7.4 billion by 2035 at 6.9% CAGR.
Nanocellulose market size: USD 600 million–1.1 billion in 2025, forecast at USD 3.4–3.9 billion by 2035 at 19–21% CAGR. Packaging accounts for roughly 40% of total demand.
7.2.5 Protein-Based Films and Chitosan Packaging
Protein-based films are made from food-industry by-products such as casein (milk), whey, zein (corn protein), and soy protein isolate, which are formed into water-soluble, edible, or home-compostable films targeting single-serve sachets, inner wrappers, and active-preservation coatings.
Lactips (France, approximately USD 45 million cumulative funding) is the commercial leader with casein-based pellets that dissolve in hot water and are certified marine biodegradable.
Chitosan packaging is derived from the chitin in crustacean shells and fungal cell walls.
It is naturally antimicrobial and film-forming, and is used as shelf-life-extending coatings and as foam cushioning.
Cruz Foam (USA, approximately USD 25 million raised) produces chitosan-based EPS replacements.
Tidal Vision (USA) closed a USD 140 million Series B in February 2025 to scale chitosan extraction at industrial volume.
The global chitosan market is estimated at USD 2.34 billion in 2025, growing to USD 4.11 billion by 2030 at 11.9% CAGR.
7.3 Emerging Materials Market Size and Growth
The combined market for next-generation packaging materials remains small relative to established alternatives, but individual sub-categories are scaling at rates well above the sustainable packaging average.
| Material | 2025 Market Size (USD) | Forecast | CAGR |
|---|---|---|---|
| Cellulose films | $3.8B | $7.4B by 2035 | 6.9% |
| Agricultural waste composites | $3.2B | $5.1B by 2030 | 9.8% |
| Chitosan (all applications) | $2.34B | $4.11B by 2030 | 11.9% |
| Nanocellulose (all applications) | $0.6–1.1B | $3.4–3.9B by 2035 | 19–21% |
| Seaweed packaging | $0.67–0.77B | $1.0–1.4B by 2035 | 6–7% |
| Mycelium packaging | $85–90M | $220–230M by 2035 | 9.4–9.7% |
Insight — Technology Readiness
Technology Readiness Level (TRL) is a scale from 1 to 9 used to assess how close a material or technology is to commercial use.
TRL 1 to 3 is early research, TRL 4 to 6 covers laboratory and pilot validation, TRL 7 to 8 means commercial pilots are operating, and TRL 9 means the material is in full commercial production.
Cellulose films (NatureFlex) and bagasse composites sit at TRL 9.
Mycelium protective packaging and casein films are at TRL 7 to 8.
Nanocellulose barrier coatings and seaweed flexibles are at TRL 6 to 7.
Whey, zein, and soy films remain at TRL 3 to 6.
This spread matters for procurement: some of these materials can be specified in purchase orders today, while others are 3 to 7 years from reliable supply at packaging volume.
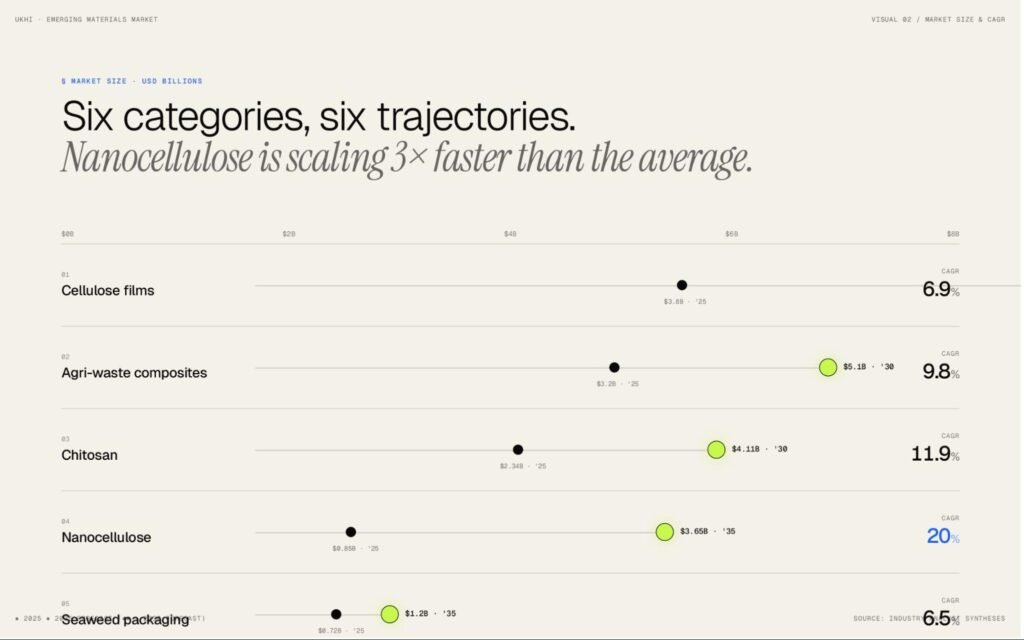
7.4 Geographic Hotspots for Emerging Materials
Geographic concentration in next-generation materials follows feedstock availability and research infrastructure:
- USA and UK lead mycelium and seaweed funding, with Ecovative, Cruz Foam, Sway, Notpla, and Kelpi all headquartered in these markets.
- Finland, Canada, and Japan dominate nanocellulose, with Stora Enso, CelluForce, and Nippon Paper anchoring commercial supply.
- France and the Netherlands lead protein films (Lactips) and starch-fiber hybrids (PaperFoam).
- India holds a competitive advantage across multiple categories simultaneously. The country produces 500 million tonnes of crop residue annually (providing feedstock for agricultural waste composites and mycelium), has a sovereign seaweed development programme (PMMSY, INR 637 crore), deep public research capability in CSIR and IIT laboratories, and a growing cohort of funded startups including Dharaksha, Bambrew, Sea6, and Zerocircle. India is one of the few markets where multiple frontier packaging categories can scale from domestic feedstock at the same time.
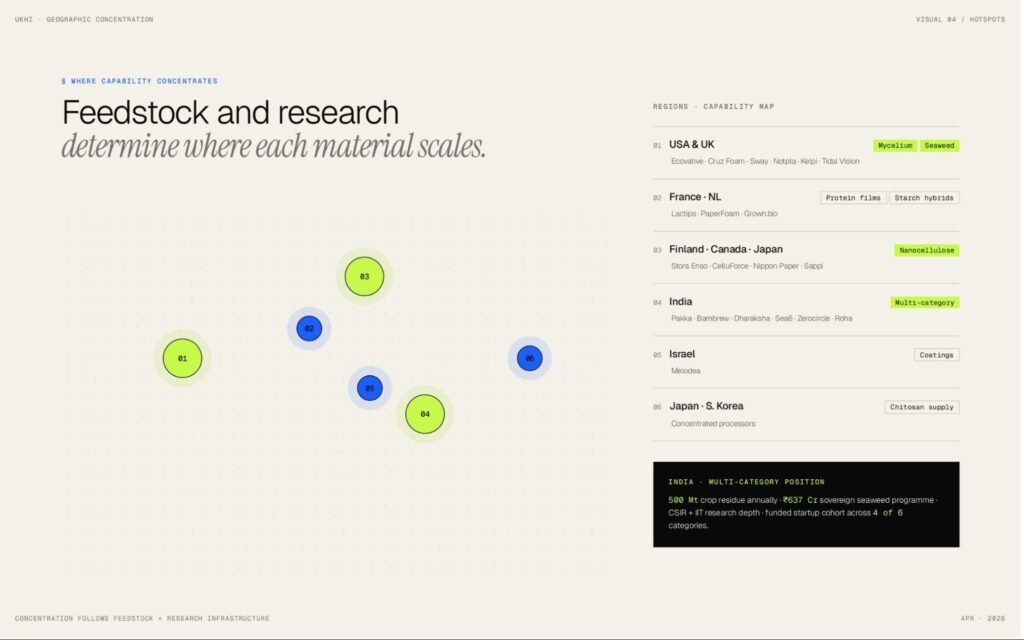
7.5 Key Applications for Emerging Materials
Different next-generation materials are ready for different applications today:
- Electronics protective packaging — Mycelium (Ecovative, Dharaksha) and PaperFoam are commercially viable now, with documented use at Apple, Dell, T-Mobile, and V-Guard.
- Food service and takeaway — Notpla seaweed boxes and Pakka bagasse products serve restaurant chains commercially at scale.
- Flexible food wrapping and sachets — NatureFlex cellulose film is fully commercial. Seaweed films (Sway, Kelpi) and casein films (Lactips with Walki Group) are entering commercial supply.
- Fresh food preservation — Chitosan coatings are commercially available in agricultural and food-service supply chains in Asia and are entering European regulatory pathways.
- Cosmetics and pharmaceutical packaging — Nanocellulose barrier coatings and NatureFlex films are being qualified for blister packs and primary packaging in partnership with Sanofi, GSK, and several generic manufacturers in India.
7.6 Innovation Pipeline and Investments in Emerging Packaging Materials
Disclosed venture capital into next-generation packaging materials between 2020 and 2025 exceeded USD 1 billion.
The largest rounds include:
- Tidal Vision at USD 140 million,
- Ecovative at USD 120 million cumulative,
- Sea6 Energy at USD 48.4 million,
- Notpla at USD 47.3 million,
- Lactips at approximately USD 45 million,
- Cruz Foam at USD 25 million, and
- Bambrew at USD 20.2 million.
Active strategic investors include Temasek, BASF Venture Capital, Amazon’s Climate Pledge Fund, Kering Ventures, and Closed Loop Partners.
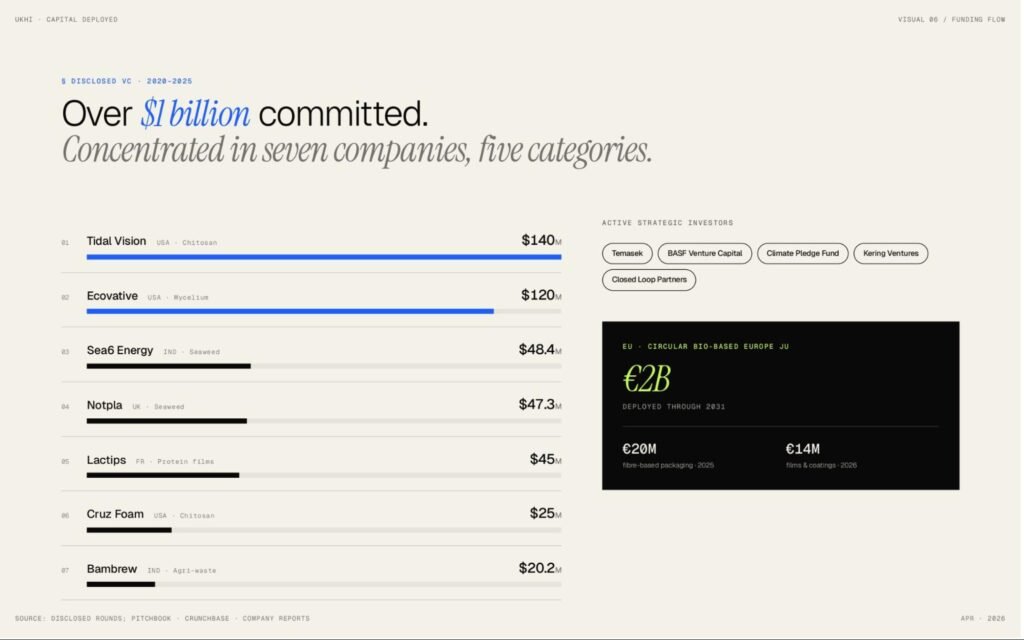
The EU’s Circular Bio-based Europe Joint Undertaking is deploying EUR 2 billion through 2031, with EUR 20 million dedicated to fiber-based packaging in 2025 and EUR 14 million to films and coatings in 2026.
7.7 Emerging Materials Drivers and Challenges
7.7.1 Growth Drivers for Emerging Materials
Regulatory removal of conventional alternatives is the most powerful driver.
When EPS food service packaging is banned (now in over 100 jurisdictions) and PFAS-coated paper is restricted under the EU PPWR, novel materials inherit application-level demand rather than competing for marginal share.
Brand net-zero commitments under Scope 3 emissions reporting (ISSB standards, EU CSRD) are forcing packaging decisions to C-suite level.
Materials with documented low-carbon life-cycle assessments attract disproportionate procurement interest.
Agricultural waste as a feedstock asset gives countries like India a cost and policy advantage. The regulatory and social pressure to stop crop residue burning creates a direct tailwind for companies that convert stubble into packaging.
7.7.2 Growth Drivers for Emerging Materials
Cost premiums remain significant across almost every material.
Mycelium is 2–4 times the cost of EPS.
Seaweed film at commercial volumes remains 3–5 times the cost of conventional polybags.
Nanocellulose barrier coatings add 15–25% to substrate cost.
Cost parity timelines of 2–5 years depend on volume commitments that require either regulatory mandates or strong brand pull.
Food-contact certification gaps are slowing adoption.
FDA food-contact notifications, EFSA opinions, and BIS standards in India are not keeping pace with material innovation.
Seaweed, mycelium, and protein films each face multi-year certification timelines that restrict food-direct applications even when the materials are technically safe.
Feedstock supply chains are immature.
Chitosan supply is concentrated in Japanese and South Korean processors.
Seaweed cultivation outside Asia is nascent.
Mycelium’s 4–7 day grow cycle creates a throughput ceiling that does not apply to conventional extrusion or moulding processes.
Moisture sensitivity affects several materials including casein films, some seaweed formulations, and uncoated mycelium parts.
This limits application scope without secondary barrier layers that can complicate end-of-life performance.
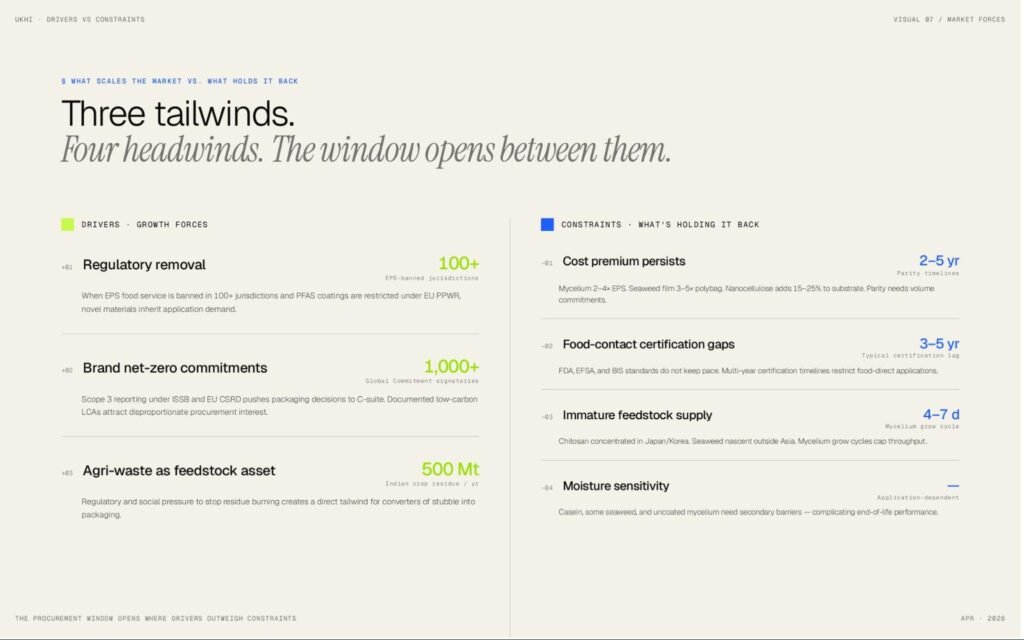
The Bottom Line
Next-generation packaging materials are a pipeline of distinct material platforms, each at a different stage of commercial readiness, each targeting a different slice of the market that established sustainable alternatives cannot adequately serve.
For procurement teams, the right question is not whether these materials will scale (the funding has already committed to ensuring they do) but which application, which supplier, and which certification pathway to engage now, before the regulatory window opens and supply tightens.
8. Sustainable Packaging Materials — Comparative Analysis
Each material chapter in this report has examined one packaging category in depth.
But packaging decisions are not made within a single material category.
For instance, a procurement lead choosing packaging for a new product line may need to:
- compare paper against bioplastics against recycled plastics against molded fibre
- and then across cost, performance, regulatory compliance, and environmental credentials
This chapter provides that cross-material comparison.
8.1 Comparison 1: Cost Position
Cost is the most frequently requested comparison and the hardest to make fairly, because equivalent functionality requires different quantities of material.
The table below reflects mid-2025 costs of materials at the converted-package level, not raw resin or pulp prices.
| Material Switch | Conventional Benchmark | Cost Premium Over Conventional | Key Caveat |
|---|---|---|---|
| rPET vs virgin PET | Virgin PET at ~USD 1,000–1,400/t | +70–80% | Narrows when UK PPT (£228/t) and EU EPR fees are factored in, but does not yet close |
| PLA vs virgin PET | Virgin PET at ~USD 1,000–1,400/t | +60–100% | Overcapacity in PLA (35% utilisation in 2024) is putting downward pressure on pricing |
| PHA vs conventional PE/PP | Virgin PE/PP at ~USD 1,000–1,500/t | +200–350% | The highest premium of any commercial bioplastic; extraction costs account for 30–50% |
| PBAT vs LDPE | LDPE at ~USD 1,200–1,500/t | +10–50% | Chinese FOB prices have fallen ~15% since 2023; most cost-competitive biodegradable polymer |
| Bio-PE vs fossil PE | Fossil PE at ~USD 1,000–1,500/t | +30–40% | Premium widened in 2025 due to Brazilian sugarcane drought |
| Paper bag vs HDPE bag | HDPE bag at 1–3 cents | +200–400% per bag | Paper bag weighs ~6x more; transport LCA often reverses the sustainability case |
| Molded fibre (thermoformed) vs EPS | EPS clamshell | +100–200% per unit | Approaches parity at high volume; cost parity forecast 2027–2028 |
| Bagasse clamshell vs plastic | Plastic clamshell | +30–80% | Gap narrows significantly when plastic ban compliance costs are included |
| NatureFlex cellulose film vs OPP film | OPP film | +15–35% | Fully certified and commercially available at scale; smallest premium in the table |
| Mycelium cushioning vs EPS | EPS protective insert | +150–300% | Cost parity forecast 2027–2028 in North America and Europe |
Insight — The Cost Gap Is Not Static
Plastic taxes, EPR fees, PFAS compliance costs, and recycled content mandates are all cost headwinds on the conventional side. The cost calculation for a packaging switch made in 2026 is materially different from one made in 2022. Procurement teams should model total landed cost including regulatory compliance, not just unit material cost.
8.2 Comparison 2: Environmental Performance
Environmental comparisons depend heavily on which metric is used and whether the assessment is cradle-to-gate (production only) or cradle-to-grave (including end-of-life).
| Material | Cradle-to-Gate Carbon Footprint | End-of-Life Advantage | End-of-Life Limitation |
|---|---|---|---|
| Paper & cardboard | Higher than plastic per functional unit in 13 of 14 applications studied (EST 2024) due to weight | Biodegradable, widely recyclable (83% rate in EU), low litter persistence | Heavier per unit function; coatings (PE, PFAS) compromise recyclability and compostability |
| PLA | ~0.5 kg CO₂e/kg (sugarcane-based, cradle-to-gate) | Industrially compostable (EN 13432, ASTM D6400) | Does not home compost; contaminates PET recycling at >0.1% concentration |
| PHA | Variable; methane-derived PHA certified at −88 kg CO₂e/kg (Newlight, Carbon Trust) | Home compostable, soil biodegradable, marine biodegradable | Expensive to produce; limited commercial composting infrastructure |
| Bio-PE | −2.1 to −3.1 kg CO₂e/kg (sugarcane absorbs CO₂ during growth) | Recyclable in existing PE streams | Not biodegradable; sustainability case rests entirely on biogenic carbon |
| rPET (mechanical) | 70–79% lower CO₂ than virgin PET | Keeps material in closed loop; bottle-to-bottle is proven | Quality degrades after 5–9 cycles; downcycling to fibre is common |
| rHDPE (mechanical) | ~60–70% lower CO₂ than virgin HDPE | Established recycling streams for bottles and containers | Food-contact approval very limited; mostly non-food applications |
| Molded fibre (bagasse) | Low; uses agricultural waste as feedstock | Home compostable (uncoated), recyclable in paper streams | Barrier coatings needed for wet/oily food compromise compostability |
| Mycelium | Very low; grown on agricultural waste | Home compostable in 30–45 days; no microplastic residue | Moisture-sensitive; limited to protective and dry applications |
| Cellulose film (NatureFlex) | Moderate; derived from managed wood pulp | Home compostable; exempt from EU SUP Directive | Limited moisture barrier without additional coating layers |
Insight — No Single Material Wins on Every Metric
Paper wins on recycling infrastructure and consumer perception but loses on weight-adjusted carbon. Bio-PE wins on cradle-to-gate carbon (negative footprint) but offers no biodegradability. rPET wins on carbon reduction versus virgin but depends on collection systems that recycle only 9% of plastic globally. PHA wins on end-of-life versatility but costs 3–4 times conventional alternatives. So, the “most sustainable” material is always application-specific.
8.3 Comparison 3: Barrier Properties and Functional Performance
This comparison matters most for food and beverage packaging, where barrier performance determines shelf life, food safety, and regulatory compliance.
Many sustainable materials require coatings or laminates to match conventional plastic performance, and those coatings can compromise the material’s end-of-life credentials.
| Material | Moisture Barrier | Oxygen Barrier | Grease Barrier | Heat Resistance | Food-Contact Status |
|---|---|---|---|---|---|
| Conventional PE/PP/PET | Excellent | Good to excellent | Good | Good (PP to 130°C) | Fully approved globally |
| Paper (uncoated) | Very poor | Very poor | Very poor | Good (dry heat) | Approved (virgin grades) |
| Paper (PE-coated) | Good | Moderate | Good | Moderate | Approved, but coating compromises recyclability |
| PLA | Moderate | Moderate | Good | Poor (softens at 55–60°C) | Approved (EN, FDA) for cold and ambient applications |
| PHA | Good | Good | Good | Moderate (varies by grade) | Approved for limited applications; expanding |
| PBAT/starch blends | Poor to moderate | Poor | Moderate | Moderate | Approved for specific food-contact grades |
| Bio-PE/Bio-PET | Same as fossil PE/PET | Same as fossil PE/PET | Same as fossil PE/PET | Same as fossil PE/PET | Same approvals as fossil equivalents |
| rPET | Same as virgin PET | Same as virgin PET | Same as virgin PET | Same as virgin PET | Approved (EFSA, FDA) for food contact after SSP |
| Molded fibre (uncoated) | Very poor | Very poor | Very poor | Good (bagasse to ~120°C) | Approved for dry food contact |
| Cellulose film (NatureFlex) | Moderate (coated grades) | Moderate to good | Moderate | Moderate | Approved; home compostable grades available |
Key Takeaway — The Barrier-Sustainability Trade-Off
The materials with the best environmental end-of-life credentials (paper, PLA, molded fibre, mycelium) have the weakest barrier properties. The materials with the best barrier properties (conventional plastics, bio-PE/bio-PET drop-ins, rPET) are either not biodegradable or depend on recycling infrastructure. This trade-off is the central tension in sustainable packaging and is unlikely to be fully resolved by any single material in the near term.
8.4 Comparison 4: End-of-Life Pathways
| Material | Curbside Recyclable? | Industrially Compostable? | Home Compostable? | Soil/Marine Biodegradable? | Compatible with Reuse Systems? |
|---|---|---|---|---|---|
| Paper (uncoated) | Yes | Yes | Yes | Biodegradable (not certified marine) | Limited (durability constraint) |
| Paper (PE-coated) | Limited (specialist mills only) | Some grades (if D6868 certified) | Rarely | No | No |
| PLA | No (contaminates PET stream) | Yes | Generally no | No | No |
| PHA | No | Yes | Yes | Yes (soil and marine certified) | No |
| PBAT/starch blends | No | Yes | Some grades | Soil biodegradable (EN 17033) | No |
| Bio-PE/Bio-PET | Yes (same streams as fossil) | No | No | No | Yes (same durability as fossil) |
| rPET | Yes | No | No | No | Yes (if designed for reuse) |
| rHDPE | Yes | No | No | No | Yes (if designed for reuse) |
| Molded fibre (uncoated) | Yes (paper stream) | Yes | Yes | Biodegradable in soil | Limited |
| Molded fibre (coated) | Depends on coating type | Depends on coating type | Rarely | Rarely | No |
| Mycelium | No | Yes | Yes (30–45 days) | Yes | No |
| Cellulose film | No | Yes | Yes (NatureFlex grades) | Some grades | No |
Insight — Infrastructure Determines ‘Compostability’ Outcome, Not Material Properties
A PLA cup is industrially compostable by certification, but if the city where it is sold has no industrial composting facility, it ends up in landfill where it will not compost. A rPET bottle is recyclable by design, but if collection infrastructure does not exist (as in most of the developing world), it is functionally single-use waste. The end-of-life pathway that matters is not what the material can do in theory, but what the local infrastructure will actually do with it in practice.
9. Strategic Outlook: What the Data Means for Investors and Procurement Teams
9.1 Why This Market Is Different From Most
The sustainable packaging market is growing at 6 to 9% annually across most material categories. But that headline number can be misleading if you read it the wrong way.
This market is not primarily growing because consumers are demanding sustainable packaging. It is growing because regulations are removing conventional alternatives from legal use.
That is a fundamentally different commercial dynamic, and it changes how both investors and procurement teams should think about risk and timing.
The question is which regulatory deadlines are binding, which supply chains can meet them, and where the structural supply shortfall sits.
9.2 Part 1: For Investors
9.2.1 Where Capital Is Concentrated and Where the Gaps Are
The sustainable packaging investment landscape has areas of density and areas of white space.
Where capital is dense:
Chemical recycling has attracted billions in announced capacity over the past five years. The operational results, however, are sharply divided.
Eastman’s Kingsport methanolysis facility runs at 105% of nameplate capacity with long-term offtake contracts in place with PepsiCo. That is the success case.
Against it:
• Brightmark filed for bankruptcy in March 2025 having operated at roughly 5% of rated capacity;
• Dow cancelled its 120,000 tonne-per-year Böhlen plant in August 2025;
• Neste cancelled its Vlissingen project;
• PureCycle produced 3,750 tonnes in Q4 2025 against a nameplate implying roughly 14 times that volume.
The lesson is that a general investment thesis on chemical recycling technology has a poor track record.
A specific thesis works: operators with long-term take-or-pay contracts from creditworthy brand owners, operating in jurisdictions with stable regulatory support, have a viable path to positive economics.
Without those two conditions, the technology alone is not sufficient.
Mycelium and seaweed packaging have also attracted significant venture capital relative to their current commercial scale.
• Ecovative has raised approximately USD 120 million cumulatively.
• Notpla has raised USD 47.3 million.
The capital is justified by their regulatory alignment and technology trajectory, but neither category is early-stage from an entry pricing perspective anymore.
Where capital is thin relative to commercial readiness:
Two areas are meaningfully underfunded given where they sit on the readiness scale.
Nanocellulose barrier coatings are at TRL 6 to 7 and have documented barrier performance comparable to EVOH and aluminium foil.
They sit directly in the path of the EU PPWR requirement that food-contact packaging be recyclable by 2030, because they offer a way to give paper packaging the oxygen and moisture barrier it needs without using plastic coatings.
CelluForce, Melodea, and Sappi Valida are at commercial stage, but the application layer converting nanocellulose into ready-to-specify coatings for paper converters is significantly undercapitalised.
Agricultural waste composite packaging in India is already scaling commercially.
Pakka Limited reported FY24 revenue of INR 414 crore. Bambrew has raised USD 20.2 million cumulatively.
Yet both companies remain largely undiscovered by global sustainable packaging funds, despite sitting on one of the strongest feedstock and regulatory positions of any packaging manufacturer in the world.
9.2.2 Three Types of Revenue in This Market
Not all sustainable packaging revenue is equally durable.
Investors should distinguish between three different commercial dynamics that are all grouped under the same market label.
Regulatory-mandate revenue is the most defensible category.
• Demand exists because the alternative is legally prohibited or financially penalised through taxes or EPR fees.
• rPET content mandates, EPS bans, and PFAS restrictions all create this type of demand.
• The risk is on the supply side: the rPET premium over virgin PET was 70 to 80% in mid-2025, despite years of mandated demand growth, because supply has not kept pace with regulatory targets.
Brand-commitment revenue is moderately defensible.
• Apple’s plastic elimination programme, Amazon’s replacement of all plastic air pillows globally in 2024, and McDonald’s 100% certified packaging commitment are durable, publicly disclosed supply chain decisions.
• The risk is that voluntary commitments get deferred when cost pressure rises, as many 2018 to 2020 targets have been.
Suppliers with long-term contracts are in a structurally better position than those selling on the spot market to ESG teams.
Consumer-preference revenue is the least defensible.
• Consumer willingness-to-pay surveys consistently overstate actual purchase behaviour, particularly in price-sensitive markets.
• Consumer data is a useful directional signal but it should not be the primary basis for a commercial investment thesis.
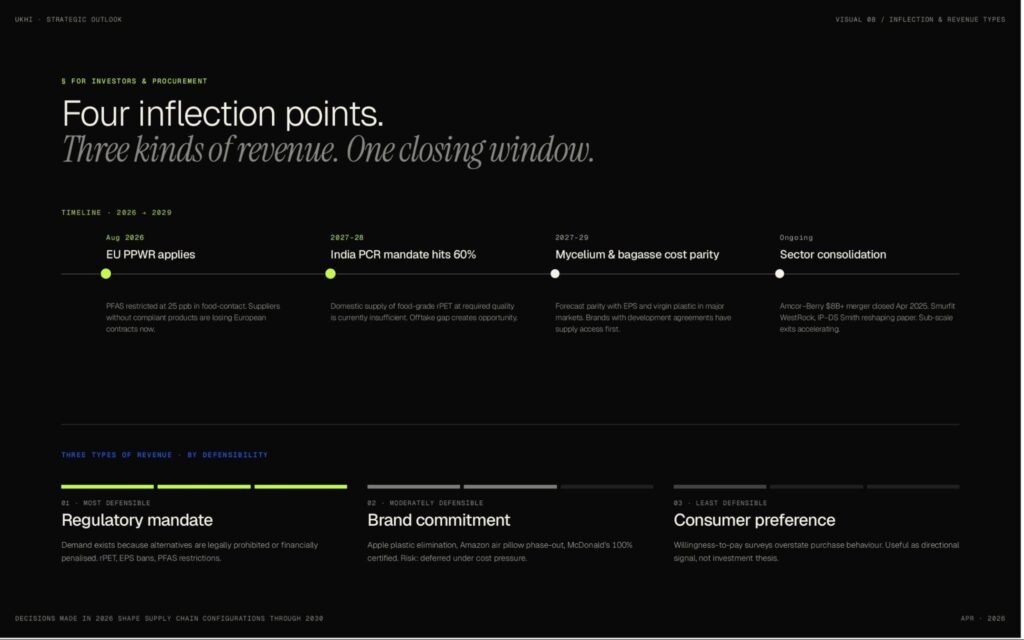
9.3.3 Sustainable Packaging Cost Premiums: Reference Data
| Material switch | Cost delta vs conventional | Key caveat |
|---|---|---|
| rPET vs virgin PET | +70 to 80% | Narrows when UK PPT and EU EPR fees are included |
| Paper bag vs HDPE bag | +200 to 400% per unit | Transport LCA reverses the sustainability case |
| Thermoformed molded fiber vs EPS | +100 to 200% | Cost parity forecast by 2027 to 2028 at volume |
| Bagasse clamshell vs plastic equivalent | +30 to 80% | Gap narrows significantly once plastic ban compliance costs are included |
| NatureFlex cellulose film vs OPP film | +15 to 35% | Fully certified, commercially available at scale today |
| Mycelium cushioning vs EPS | +150 to 300% | Cost parity forecast in major markets by 2027 to 2028 |
These gaps are real, but they are not fixed.
EPR fees, plastic taxes, and PFAS compliance costs are rising structural headwinds on the conventional packaging side of every comparison in the table above.
The cost calculation a procurement team runs in 2026 is meaningfully different from the one they would have run in 2022, and it will be different again in 2028 when India’s 60% PCR mandate bites and EPS has exited twelve US state markets entirely.
The brands and suppliers that build their packaging strategies around where these economics are heading, rather than where they currently sit, will be in a structurally stronger position when the regulatory window closes.
The decisions being made in procurement offices and investment committees in 2026 are the ones that will shape supply chain configurations for the rest of the decade.
© 2026 Ukhi Bioplastics Private Limited. All rights reserved.
References
1. General
1. Sustainable Packaging Market Size and Trends 2026-35 – Towards Packaging: https://towardspackaging.com
2. Sustainable Packaging Market (2025 – 2035) – Fact.MR: https://factmr.com
3. Sustainable Packaging Market Size, Share & Industry Report 2035 – Market Research Future: https://marketresearchfuture.com
4. Sustainable Packaging Market Size, Share, Trends Report 2034 – Fortune Business Insights: https://fortunebusinessinsights.com
5. Sustainable Packaging Market Size & Share Analysis – Mordor Intelligence: https://mordorintelligence.com
6. Sustainable Packaging Market To Reach $448.53Bn By 2030 – Grand View Research: https://grandviewresearch.com
7. India Green Packaging Market Size, Share & Report | 2033 – IMARC Group: https://imarcgroup.com
8. Market – European Bioplastics e.V.: https://european-bioplastics.org
9. The Future of Sustainable Packaging: Long-term Strategic Forecasts to 2034 – Smithers: https://smithers.com
10. Molded Fiber Packaging Market – Global Market Size, Share, and Trends Analysis Report – Industry Overview and Forecast to 2032 – Data Bridge Market Research: https://databridgemarketresearch.com
11. Middle East And Africa Sustainable Food Packaging Market Size & Share Report By 2034 – Packaging Market Insights: https://packagingmarketinsights.com
12. Sustainable Packaging Market Size, Share, Growth & Forecast 2033 – Straits Research: https://straitsresearch.com
13. Sustainable Packaging Market | Global Market Analysis Report – 2036 – Future Market Insights: https://futuremarketinsights.com
14. Eco-Friendly Food Packaging Market to Reach USD 288.33 Billion by 2031 – Barchart: https://barchart.com
15. Sustainable Packaging Market Size | Industry Forecast, 2031 – Allied Market Research: https://alliedmarketresearch.com
16. Sustainable Packaging Market – Global Opportunity Analysis and Industry Forecast (2025-2032) – Meticulous Research: https://meticulousresearch.com
17. Sustainable Packaging Market Size to Hit USD 240.52 Billion by 2034 – Precedence Research: https://precedenceresearch.com
18. Global Sustainable Packaging Market Trends & Report – Roots Analysis: https://rootsanalysis.com
19. Sustainable Packaging Global Market Report 2025 – The Business Research Company: https://thebusinessresearchcompany.com
20. Sustainable E-Commerce Packaging Market Size Report, 2025–2034 – Global Market Insights (GMI): https://gminsights.com
2. Paper Packaging
1. Corrugated Board Market Size, Share & Growth Report, 2030 – Grand View Research: https://grandviewresearch.com
2. Corrugated Packaging Market Size to Hit USD 477.33 Bn by 2034 – Precedence Research: https://precedenceresearch.com
3. Corrugated Packaging Market Size, Share & Forecast, 2025 – 2034 – Global Market Insights (GMI): https://gminsights.com
4. Paper Packaging Market Size, Share | Industry Report, 2033 – Grand View Research: https://grandviewresearch.com
5. Packaging Paper Market Size To Reach $354.53Bn By 2030 – Grand View Research: https://grandviewresearch.com
6. Paper Bags Market Size, Share, Demand & Forecast to 2034 – IMARC Group: https://imarcgroup.com
7. Paper Bags Market | Global Market Analysis Report – 2036 – Future Market Insights: https://futuremarketinsights.com
8. Folding Cartons Market Trends and Size 2026-2035 – Towards Packaging: https://towardspackaging.com
9. Aseptic Paper Packaging Market Size & Share | Industry Growth 2032 – Data Bridge Market Research: https://databridgemarketresearch.com
10. Statistics – American Forest and Paper Association (AF&PA): https://afandpa.org
11. European Corrugated Packaging Association in Brussels – FEFCO: https://fefco.org
12. Kraft Paper Market, Global Industry Size Forecast – MarketsandMarkets: https://marketsandmarkets.com
13. Pulp and paper | Forest product statistics – Food and Agriculture Organization of the United Nations (FAO): https://fao.org
14. 2025 Trend Tracker Reveals Consumer Preferences for Packaging – Two Sides North America: https://twosidesna.org
15. Statistics – International Corrugated Case Association (ICCA): https://iccanet.org
16. The Future of Global Packaging to 2028 – Smithers: https://smithers.com
17. Flexible Paper Packaging Market Size & Trends 2026-2035 – Towards Packaging: https://towardspackaging.com
18. Facts and figures – Programme for the Endorsement of Forest Certification (PEFC): https://pefc.org
19. Home – Forest Stewardship Council (FSC): https://fsc.org
20. Press release: European Paper Recycling Council Reports Strong Recycling Rates for 2024 – CEPI: https://cepi.org
3. Recycled Plastics
1. Recycled Plastics Market Size & Share | Industry Report 2033 – Grand View Research: https://grandviewresearch.com
2. Recycled Plastic Market Size to Hit USD 127.25 Billion By 2034 – Precedence Research: https://precedenceresearch.com
3. Post-Consumer Recycled Plastics Market Size Report, 2033 – Grand View Research: https://grandviewresearch.com
4. Recycled Plastics Market Size, Share, Forecast Report – Fortune Business Insights: https://fortunebusinessinsights.com
5. Recycled Plastic Market Size, Share, Growth, Trends & Forecast 2033 – Straits Research: https://straitsresearch.com
6. Recycled Plastics Market Size, Share and Analysis, 2034 – Market Data Forecast: https://marketdataforecast.com
7. Recycled Plastics Market Share & Report, 2025 – 2034 – Polaris Market Research: https://polarismarketresearch.com
8. Plastic Recycling Market Size, Share & Industry Report 2035 – Market Research Future: https://marketresearchfuture.com
9. Recycled Plastics Market | Size, Share, Trend, Industry Analysis | 2024-2032 – Stratview Research: https://stratviewresearch.com
10. Recycled Plastics Market Size, Share & 2030 Outlook – Mordor Intelligence: https://mordorintelligence.com
11. Recycled PET Bottles Market Size & Trends 2026-2035 – Towards Packaging: https://towardspackaging.com
12. 100% rPET Bottle and Container Market (2025 – 2035) – Future Market Insights: https://futuremarketinsights.com
13. Global Plastics Outlook – OECD: https://oecd.org
14. ICIS Recycling Supply Trackers – Mechanical and Chemical – ICIS: https://icis.com
15. 2024 Data Reveals a Deepening Crisis of the European plastics recycling industry – Plastics Recyclers Europe: https://plasticsrecyclers.eu
16. U.S. Plastics Recycling Rate Slumps Below 6%, Analysis Finds – Beyond Plastics: https://beyondplastics.org
17. The Global Commitment 2024 Progress Report – Ellen MacArthur Foundation: https://ellenmacarthurfoundation.org
18. Closed Loop Partners Releases First-of-its-Kind Report Evaluating the Role of Molecular Recycling Technologies in Addressing Plastic Waste – Closed Loop Partners: https://closedlooppartners.com
19. India Recycling Market Size & Share Outlook to 2031 – Mordor Intelligence: https://mordorintelligence.com
20. Packaging waste – Environment – European Commission: https://europa.eu
4. Molded Fiber
1. Molded Fiber Packaging Market Size & Share Analysis – Mordor Intelligence: https://mordorintelligence.com
2. Molded Pulp Packaging Market Size | Industry Report, 2033 – Grand View Research: https://grandviewresearch.com
3. Molded Pulp Packaging Market, Industry Size Forecast – MarketsandMarkets: https://marketsandmarkets.com
4. Molded Fiber Packaging Market Size, Share & Industry Forecast 2035 – Market Research Future: https://marketresearchfuture.com
5. Molded Fiber Pulp Packaging Market Size & Forecast 2025-2032 – Coherent Market Insights: https://coherentmarketinsights.com
6. Molded Fiber Packaging Market Size, Share | Forecast – Fortune Business Insights: https://fortunebusinessinsights.com
7. Molded Fiber Pulp Packaging Market to Hit USD 8,815.0 Million by 2036 – Future Market Insights: https://futuremarketinsights.com
8. Molded Pulp Packaging Market Size, Share | Report 2033 – IMARC Group: https://imarcgroup.com
9. Molded Fiber Packaging Market Size & Forecast Analysis – 2032 – Global Market Insights (GMI): https://gminsights.com
10. Molded Fiber Packaging Market Grows to USD 16.50 Bn by 2035 – Towards Packaging: https://towardspackaging.com
11. Molded Fiber Packaging – Market Size, Market Share, Market Leaders, Demand Forecast – The Freedonia Group: https://freedoniagroup.com
12. The Future of Moulded Pulp Packaging to 2028 – Smithers: https://smithers.com
13. Bagasse Tableware Products Market Size Report, 2030 – Grand View Research: https://grandviewresearch.com
14. Egg Packaging Market Attains USD 10.71 Bn by 2034 – Towards Packaging: https://towardspackaging.com
15. Apple accelerates progress with highest-ever recycled material in its products – Apple: https://apple.com
16. Samsung Electronics to Replace Plastic Packaging with Sustainable Materials – Samsung: https://samsung.com
17. Molded Fiber 101 – International Molded Fiber Association (IMFA): https://imfa.org
18. PulPac – home of Dry Molded Fiber – PulPac: https://pulpac.com
19. About Pakka | Sustainable Bagasse Packaging from India – Pakka: https://pakka.com
20. Ecoware | Biodegradable Food Packaging – Ecoware India: https://ecoware.in
5. Emerging Materials
1. Mycelium Packaging Market Size and Trends 2026-35 – Towards Packaging: https://towardspackaging.com
2. Mycelium Packaging Market | Global Market Analysis Report – 2035 – Future Market Insights: https://futuremarketinsights.com
3. Ecovative Raises Over $30 Million, Funding Global Distribution of Planet-Friendly Fashion and Food – Business Wire: https://businesswire.com
4. UK-based Magical Mushroom Company scores €3.4 million for its plant-based sustainable packaging – EU-Startups: https://eu-startups.com
5. IKEA Starts Using Biodegradable Mushroom-Based Packaging for Its Products – We Don’t Have Time: https://medium.com
6. Roha Biotech: Revolutionizing Sustainable Packaging with Mushrooms – BioPatrika: https://biopatrika.com
7. Grown bio: making biodegradable packaging from mycelium and agricultural waste – European Circular Economy Stakeholder Platform: https://europa.eu
8. Italy’s Mogu Raises €11M to Expand Mycelium Materials for Interior Design, Fashion, and Cars – vegconomist: https://vegconomist.com
9. Dutch Dragons Shawn Harris and Pieter Schoen invest €1M in Loop Biotech, creator of ‘living’ coffin – Silicon Canals: https://siliconcanals.com
10. MycoWorks Raises $125 Million Series C – MycoWorks: https://mycoworks.com
11. France-based Lactips raises €16M to produce biodegradable plastic alternatives – Silicon Canals: https://siliconcanals.com
12. Stone Paper Market Size And Share | Industry Report, 2033 – Grand View Research: https://grandviewresearch.com
13. GFIA winner Cruz Foam secures $18 million in Series A funding – Responsible Seafood Advocate: https://globalseafood.org
14. Tidal Vision completes $140M Series B to Scale Chitosan Technologies Globally – PR Newswire: https://prnewswire.com
15. How reality crushed Ÿnsect, the French startup that had raised over $600M for insect farming – TechCrunch: https://techcrunch.com
16. Notpla scores US$13M for seaweed-based edible packaging commercialization – Packaging Insights: https://packaginginsights.com
17. Nanocellulose Market Size Worth $1517.5 Million By 2030 – Grand View Research: https://grandviewresearch.com
18. Bambrew secures $10.3m in funding to boost eco-friendly packaging – Packaging Gateway: https://packaging-gateway.com
19. Pakka Limited : With a legacy of over four decades, the business manufactures compostable flexible packaging from sugarcane waste – bagasse – Paper Desk: https://paperdesk.in
20. NatureFlex™ Cellulose Film Packaging Solutions – Futamura: https://natureflex.com
Company Directory
1. Ukhi India Private Limited
Plot -141, IMT Main Rd, Industrial Area, Sector 68
Faridabad, Haryana 121004, India
Phone: +91-96259 68232
Email: info@ukhi.com
Website: www.ukhi.com
About the Authors
This report is a collective effort by the Ukhi Research Division, with support from our leadership team and technical experts.
Lead Author:
1. Vishal Vivek
Co-founder & CEO
Email: vishal@ukhi.org
Contributors:
1. This work also benefited from contributions by Ukhi’s in-house research, commercial, and product teams.
For Further Inquiries
For questions, permissions, or requests related to this report or other Ukhi publications, please contact:
1. Research & Publications
Ukhi Bioplastics Private Limited
Email: info@ukhi.com
Phone: +91-96259 68232
Address: Plot -141, IMT Main Rd, Industrial Area, Sector 68, Faridabad, Haryana 121004, India
Website: www.ukhi.com
For media queries or speaking opportunities, please email Vishal Vivek (vishal@ukhi.com).
Note:
1. For the latest updates, product launches, or to connect with the authors, please visit www.ukhi.com or follow us on LinkedIn and other social media channels.