Compostable Polymer Straws
Global Market Explorer 2025–2035
| Jurisdiction | PLA | PHA | PBS | Paper |
|---|
Market estimates are derived using two complementary approaches. Full methodology is detailed in the report.
Introduction and Framework
About This Report
This report provides a comprehensive analysis of the global market for compostable polymer-based drinking straws covering the period 2025 to 2035. It is produced by Ukhi as an independent market intelligence resource for manufacturers, investors, procurement teams, distributors, and policymakers involved in the sustainable foodservice packaging sector.
The report covers the full landscape of compostable polymer straw materials, including PLA (polylactic acid), PHA (polyhydroxyalkanoates), PBS (polybutylene succinate) blends, and polymer-composite plant-fibre straws.
For each material, the report analyses:
- Properties and performance characteristics
- Processing and manufacturing behaviour
- Regulatory and certification status
- Regional pricing dynamics
- Global and regional market demand
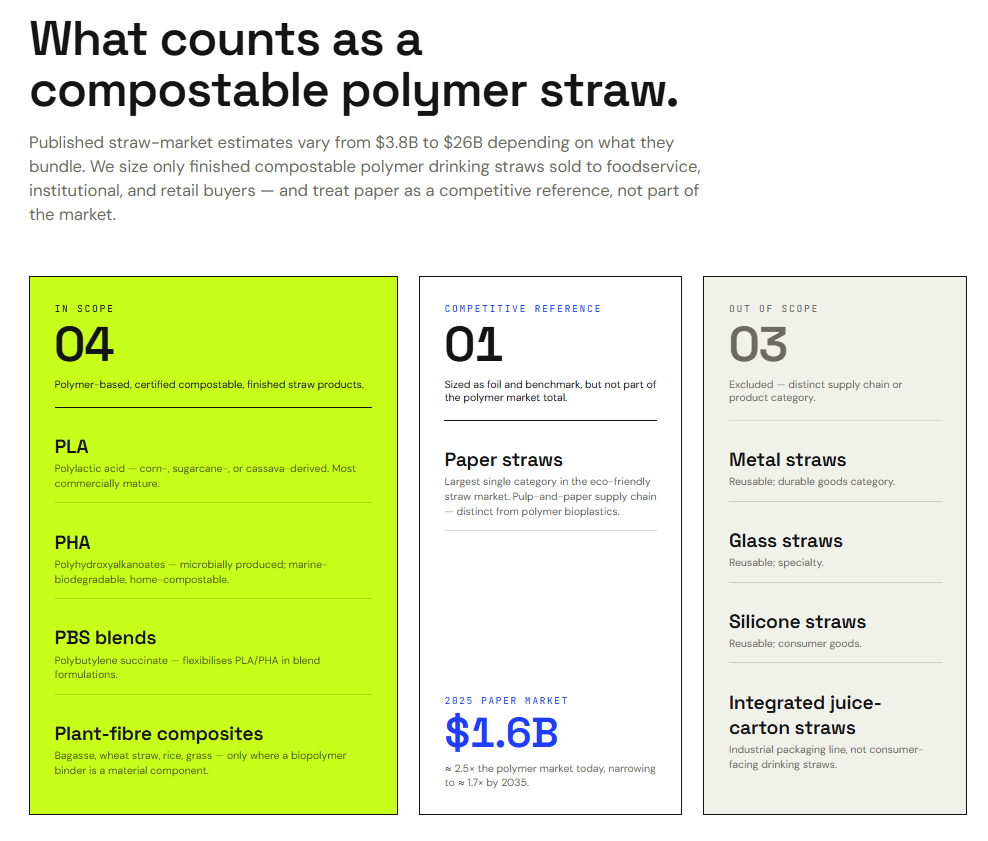
Paper straws are covered as the primary competitive reference and incumbent alternative but are excluded from the core market sizing.
Reusable straw formats (metal, glass, silicone) are noted for context but excluded from sizing and detailed analysis.
Scope and Boundaries
What is included in the core market sizing:
The market is sized at the level of finished compostable polymer straw products sold to foodservice operators, institutional buyers, and retailers.
This includes straws made from:
- PLA
- PHA
- PBS and PBS-blend formulations
- Plant-fibre composites where a biopolymer binder is a material component of the product
The measurement point is the point of sale to commercial and retail buyers, not upstream resin value or end-consumer retail price.
What is excluded from the core market sizing:
- Paper straws are excluded because they represent a distinct pulp-and-paper supply chain rather than a polymer bioplastics market. Paper is covered extensively as the primary competitive reference throughout the report.
- Pure pressed-fibre straws (sugarcane bagasse, wheat, or grass straws without a polymer binder) are excluded for consistency with the paper exclusion.
- Reusable straw formats (metal, glass, silicone) are excluded as they represent a fundamentally different product category and use case.
- Integrated industrial packaging (straws attached to juice cartons and aseptic drink boxes) is excluded. The report covers consumer-facing drinking straws only.
Geographic scope: Global, with regional analysis for North America, Europe, Asia-Pacific, and Emerging Markets (Latin America and Middle East & Africa combined).
Forecast period: 2025 to 2035.
Methodology
Market Sizing Approach
No publicly available source sizes the compostable polymer straw market exactly as scoped in this report.
Published market research covers either broader categories (all biodegradable straws including paper) or narrower ones (PHA straws only).
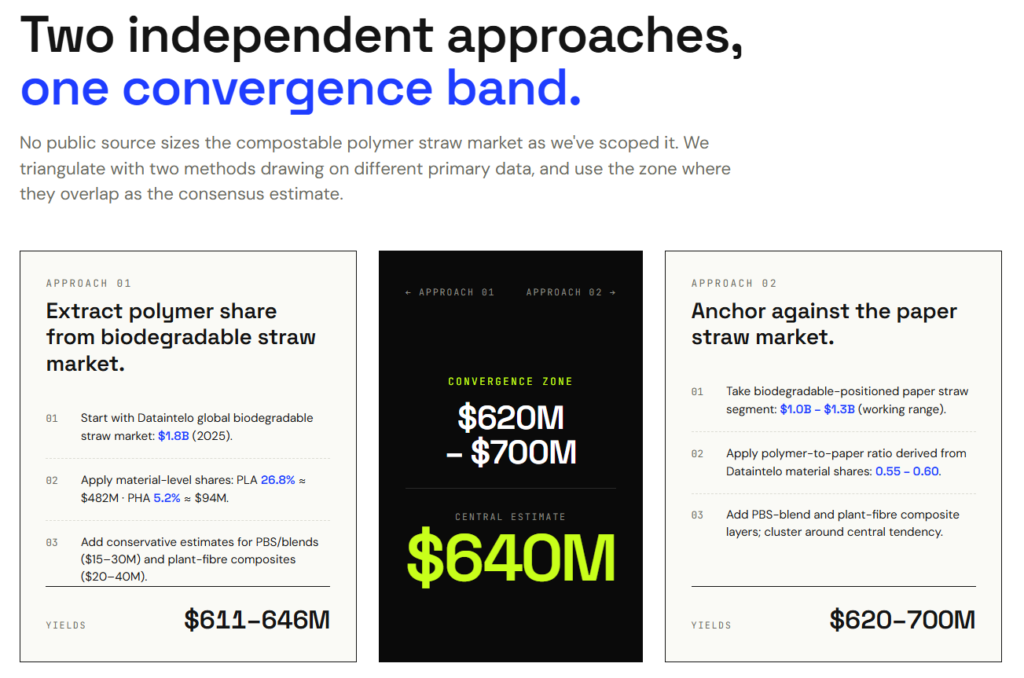
To address this, the report uses two independent analytical approaches to arrive at a consensus range, rather than relying on a single third-party estimate.
Approach 1 (Biodegradable Market Extraction)
This approach starts from the most granular available data source, which values the global biodegradable straw market at $1.8 billion in 2025 and provides material-level percentage shares for PLA and PHA.
The polymer components are extracted by applying these reported shares, and conservative estimates are added for PBS and polymer-composite plant-fibre straws, which are not broken out separately in the source data.
Approach 2 (Paper Straw Anchor)
This approach uses independent paper straw market estimates from separate research sources as the primary input.
The known ratio of polymer-to-paper sales within the eco-friendly straw segment is then applied to derive the polymer straw market size.
This approach uses a different primary data input from Approach 1, providing a partial cross-check.
The two approaches overlap in a central zone and diverge at the boundaries and produce a consensus range rather than a single point estimate.
The report adopts this range as the global market size and applies it consistently across all subsequent regional and material analyses.
Regional and Material Allocation
Regional market shares are derived by evaluating each region against four factors:
the regulatory position of polymer straws (whether regulation favours, restricts, or is neutral toward compostable polymers),
production proximity (whether local biopolymer production reduces the cost premium),
foodservice market structure (premium versus cost-sensitive), and
stage of transition from conventional plastic.
Material-level allocation within each region uses the same factor-based approach, with the additional consideration of which specific polymers are permitted or restricted in each regulatory environment.
Growth Rate Derivation
The global CAGR is built from a weighted blend of material-specific growth rates, where each material’s weight corresponds to its 2025 share of the polymer straw market.
Regional CAGRs are individually assessed based on regulatory trajectory, production capacity expansion, and foodservice market growth, and are verified by checking that the share-weighted regional blend produces a global CAGR within the adopted range.
Data Sources and Limitations
Market size data is drawn from multiple third-party research providers, cross-referenced where coverage overlaps.
All figures should be treated as informed estimates.
The report is transparent about:
where data is directly sourced,
where it is derived through calculation, and
where it is analytically estimated.
Full methodological detail, including step-by-step workings for both sizing approaches, is provided in Chapter 2.
Executive Summary
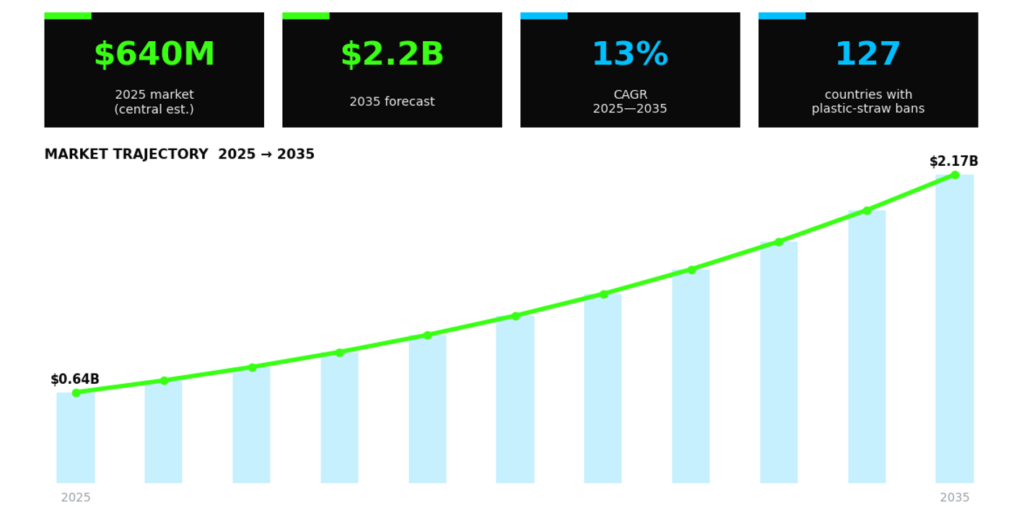
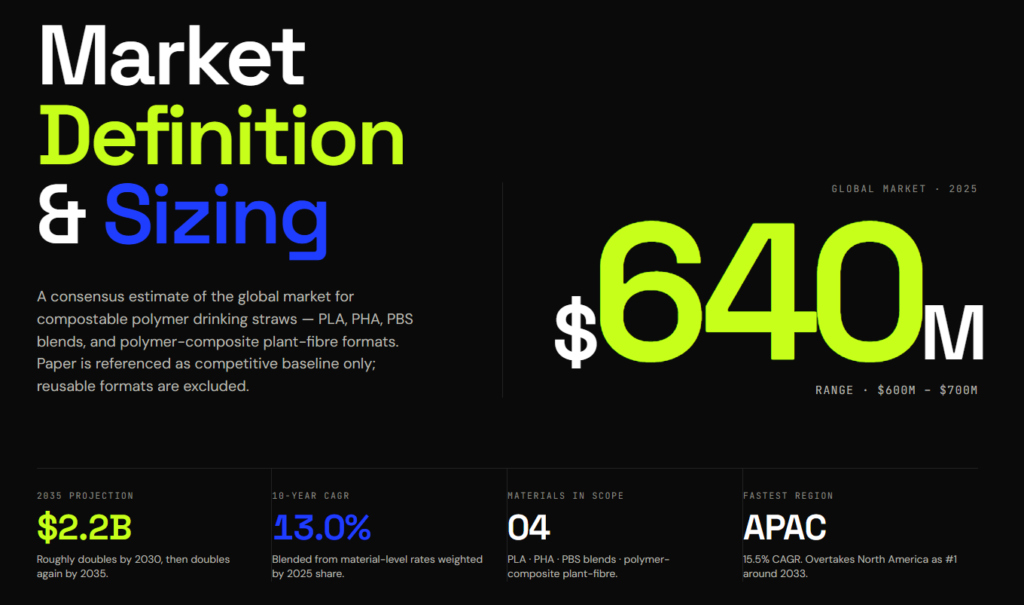
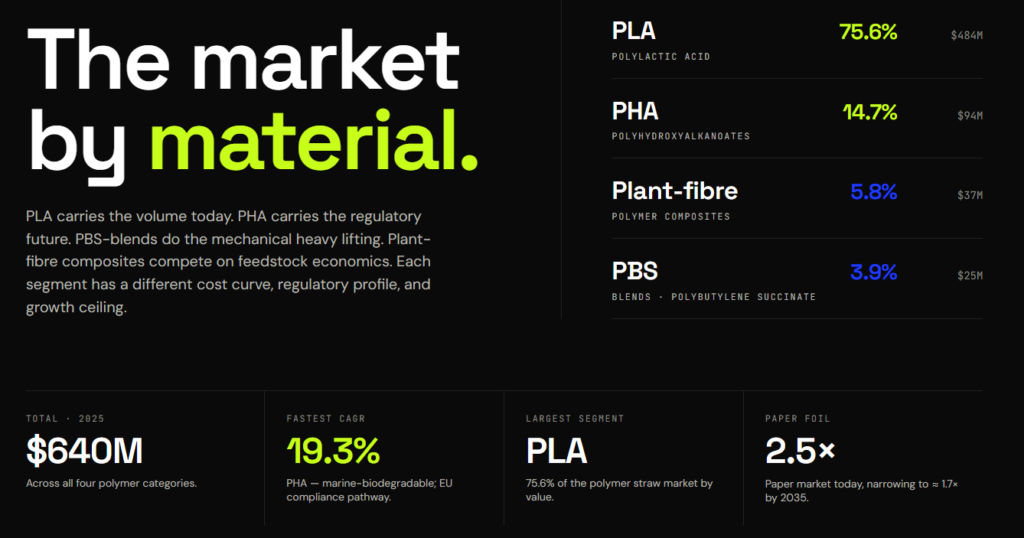
The global market for compostable polymer-based drinking straws is estimated at $600 million to $700 million in 2025, with a central estimate of approximately $640 million.
This market covers finished straw products made from:
• PLA
• PHA
• PBS blends
• Polymer-composite plant-fibre formats
These products are sold to foodservice operators, institutional buyers, and retailers worldwide.
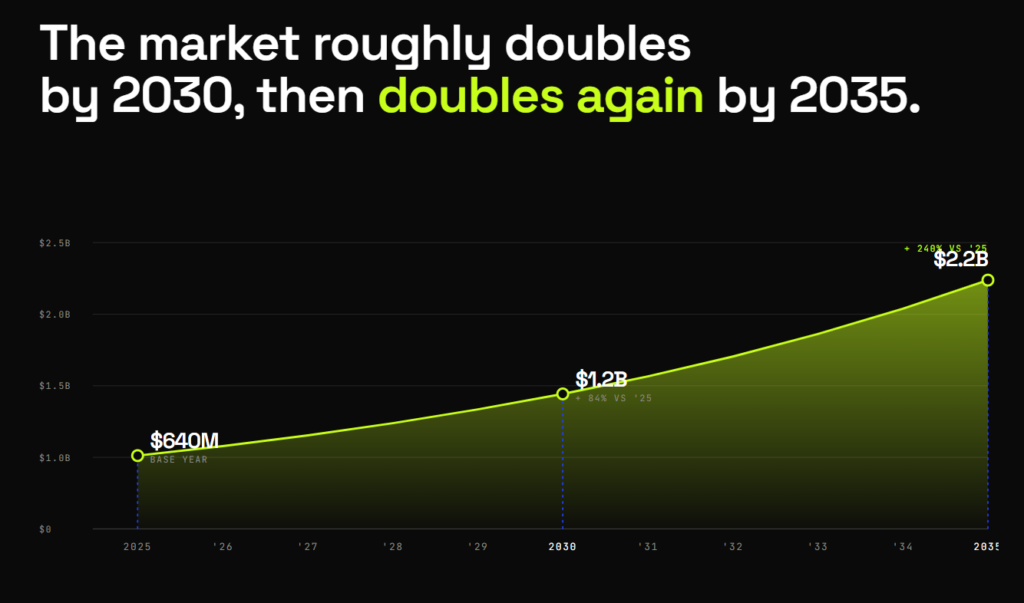
The market is forecast to grow at a CAGR of 13%, reaching approximately $2.2 billion by 2035.
Growth is driven by:
• Regulatory bans on single-use plastic straws across more than 127 countries
• Sustainability commitments from major foodservice chains
• Rising consumer preference for plastic-free dining
• Advances in biopolymer production that are gradually narrowing the cost gap with conventional plastic
Key Findings
1. PLA dominates today, but PHA is the fastest-growing material.
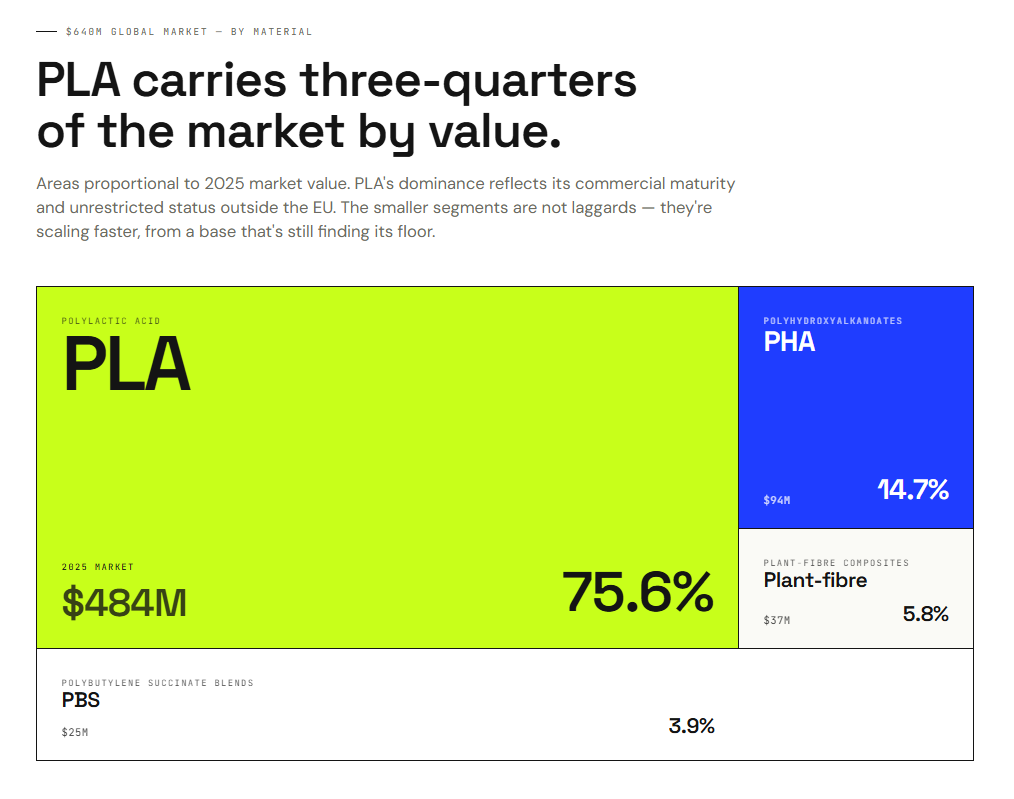
PLA accounts for approximately 76% of the compostable polymer straw market ($484 million), making it the commercial incumbent.
However, PLA faces a structural ceiling in Europe where both the EU Single-Use Plastics Directive and the UK’s own single-use plastic straw ban restrict it alongside conventional plastic.
2. The EU’s PLA ban reshapes global material flows.
The classification of PLA as “plastic” under both the EU SUP Directive and UK straw ban regulations is the single most important regulatory fact in this market.
PLA is restricted across all 27 EU member states and the UK, which together represent the vast majority of European straw demand.
This:
• Suppresses Europe’s polymer straw market (23% of global, versus 28.4% of the broader biodegradable market)
• Pushes European demand toward paper
• Makes Europe the world’s largest PHA straw market by a wide margin (75% of global PHA straw sales)
The remaining European PLA market exists primarily through Italy’s compostable bioplastic exemption, which is itself subject to EU infringement proceedings.
Any future regulatory clarification permitting certified compostable polymers in the EU or UK would significantly expand the addressable market.
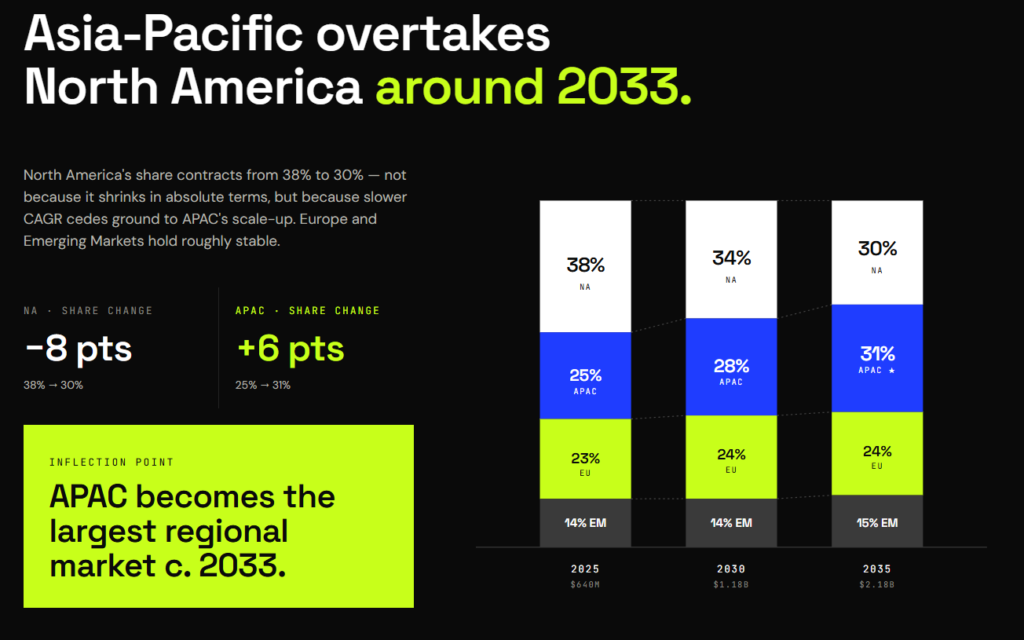
3. Asia-Pacific will overtake North America as the largest market by 2033.
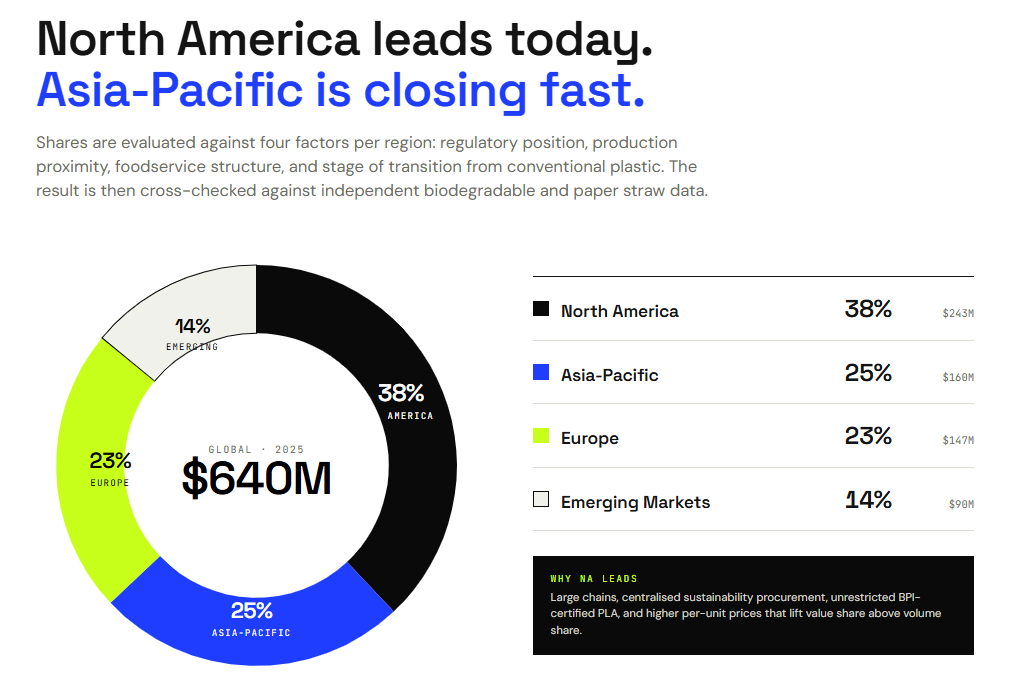
North America leads today with 38% of the global market ($243 million), driven by unrestricted PLA access and chain-driven foodservice procurement.
Asia-Pacific (25%, $160 million) is the fastest-growing region at 15.5% CAGR, propelled by:
• China’s PLA production scale
• Progressive plastic bans
• Structural foodservice growth
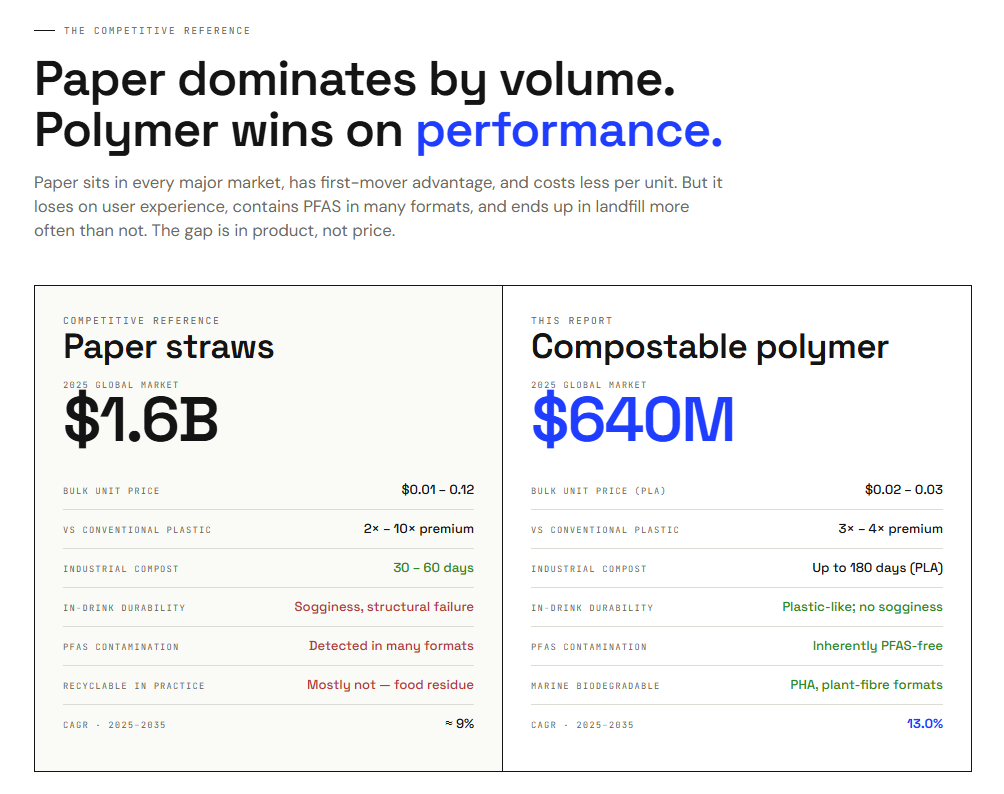
4. Paper straws remain 2.5 times larger but are losing share.
The consumer-facing paper straw market is approximately $1.6 billion in 2025, roughly 2.5 times the polymer straw market.
Paper benefits from:
• Lower cost
• Broad regulatory acceptance
• First-mover advantage
However, polymer straws are growing faster (13% versus 9.0% CAGR for paper), and paper faces escalating concerns over:
• Sogginess
• PFAS contamination
• Structural failure
These issues are driving quality-conscious buyers toward polymer alternatives.
5. The composting infrastructure gap is the market’s largest structural risk.
Compostable straws deliver their environmental benefit only when they are actually composted.
Most polymer straws require industrial composting facilities, and such infrastructure is scarce:
• The US has fewer than 100 facilities capable of processing certified compostable packaging.
Without infrastructure expansion, the market faces a credibility gap between its environmental claims and real-world outcomes, which regulatory bodies and consumers are increasingly scrutinising.
Compostable Polymer Straws – Overview
Compostable polymer straws are drinking straws made from plant-derived plastics and natural fibre composites that are engineered to match the functional performance of conventional plastic while offering a verified biological end-of-life pathway.
This chapter defines:
• What compostable polymer straws are
• How they are manufactured
• How they compare with conventional and paper alternatives
• Which performance standards they must meet to be commercially viable
1.1 The Drinking Straw as a Product
A drinking straw is a deceptively simple product.
It must:
• Hold its shape
• Resist the liquid it is submerged in
• Feel comfortable in the mouth
• Not alter the taste of the drink
These requirements are easy to meet with polypropylene (PP), the conventional plastic used in most single-use straws.
The challenge for compostable alternatives is meeting the same functional bar while using materials that are designed to break down in either an industrial composting environment or in a home compost bin.
The dimensions of standard commercial straws fall within a narrow range:
• Lengths of 200mm to 230mm
• Diameters of 6mm (standard) or 8mm (jumbo, commonly used for smoothies and bubble tea)
Beyond straight straws, the market also requires:
• Flexible “bendy” straws with corrugated sections
• Wider formats for foodservice applications
These dimensions reflect decades of ergonomic and operational standardisation across foodservice.
A straw that deforms before a customer finishes a drink, or that collapses under the pressure of a thick liquid, is a commercial failure regardless of its environmental credentials.
1.2 What Makes a Polymer Straw Compostable
Compostability is a certified performance claim, not an intrinsic material property.
• A material can be plant-derived without being compostable.
• A product can be labelled biodegradable without meeting any regulated standard.
For a polymer straw to be genuinely compostable, it must pass independently verified tests covering four criteria:
• Characterisation (limits on heavy metals and harmful substances)
• Biodegradability (conversion of carbon to CO₂)
• Disintegration (physical fragmentation within a defined timeframe)
• Compost quality (no toxic residue in the resulting soil)
Industrial vs. Home Composting
The distinction between industrial composting and home composting is critical but is poorly understood in commercial and policy contexts.
Industrial composting
Industrial composting takes place in municipal or commercial facilities that maintain:
• Sustained high temperatures (55 to 60°C)
• Controlled aeration
• Consistent moisture levels
These conditions accelerate microbial activity significantly.
Most commercially available compostable straws, including the majority of PLA-based products, require industrial composting to fully break down within certification-required timeframes.
Home composting
Home composting occurs in backyard bins or piles at ambient temperatures of roughly 20 to 30°C.
Conditions for home composting vary considerably and microbial activity is weaker.
Achieving home compostability certification is substantially harder and limits the materials that can qualify.
Very few polymer straw products currently carry home compostability certification.
Why this matters: A straw certified only for industrial composting provides no end-of-life benefit if it is collected through a general waste stream and sent to landfill. Compostability as an environmental benefit is only realised when the correct collection and processing infrastructure exists.
Key Certification Standards for Compostability
The main internationally recognised standards are:
• EN 13432 (Europe): Requires 90% carbon-to-CO₂ conversion within six months and physical disintegration (less than 10% residue larger than 2mm) within 12 weeks under industrial composting conditions. This is the governing standard for packaging placed on the European market.
• ASTM D6400 (North America): The primary US standard for plastics designated for industrial composting facilities.
• AS 5810 (Australia): Covers home composting specifically, using lower test temperatures and a longer assessment period of 180 days.
• TÜV OK Compost (Global): Certification marks issued by TÜV Austria for both industrial (“OK Compost INDUSTRIAL”) and home (“OK Compost HOME”) conditions. The HOME mark is among the most rigorous certifications in the market.
• BPI (North America): Issued by the Biodegradable Products Institute, this certification confirms compliance with ASTM D6400 and is widely used as a de facto commercial standard by US foodservice operators and distributors.
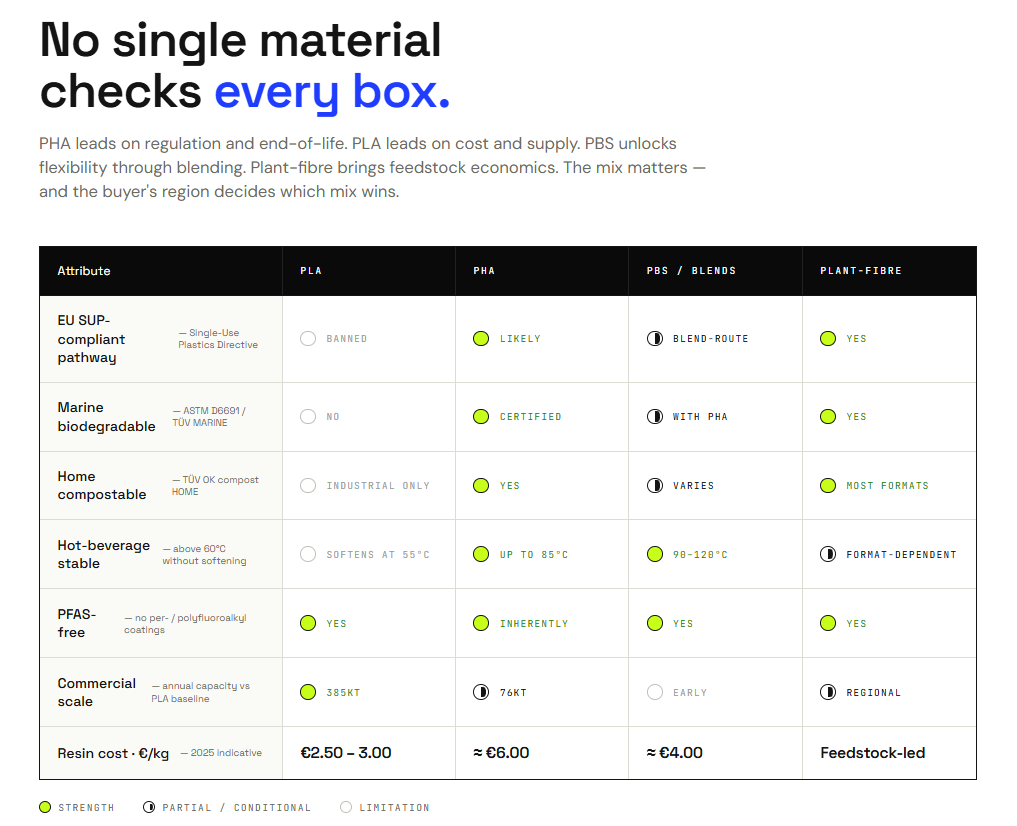
1.3 Compostable Polymer Straws vs. the Alternatives
Compostable polymer straws compete across several product categories.
Understanding where they win and where they lose against each format is essential context for the market analysis in later chapters.
Compostable Polymer Straws vs. Paper Straws
Paper straws are currently the dominant alternative to single-use plastic straws across most regulated markets.
They benefited from:
• First-mover advantage following early plastic straw bans
• Broad acceptance under most regulatory frameworks
However, paper straws have a well-documented performance problem.
In liquid contact, paper straws lose a significant proportion of their compressive strength within 30 minutes.
The resulting sogginess is the single most consistent consumer complaint in post-ban foodservice research.
Polymer-based compostable straws maintain structural integrity for several hours under the same conditions, which makes them a functionally superior product.
A separate and more serious concern has emerged around PFAS contamination linked to paper straws.
PFAS (per- and polyfluoroalkyl substances, sometimes called “forever chemicals”) are used as water-resistant coatings in some paper straw manufacturing.
Research has found PFAS present in a significant share of paper straws tested.
Certified compostable polymer straws are generally verified PFAS-free, which is an increasingly important commercial and regulatory consideration.
Insight: Paper straws hold market share primarily because of cost and regulatory acceptance, not functional performance. As compostable polymer straw costs fall and regulatory clarity improves, the performance gap will represent a meaningful commercial opportunity.
Compostable Polymer Straws vs. Conventional Plastic (Polypropylene)
Polypropylene (PP) straws remain the functional benchmark in the straws market.
Compostable polymer straws broadly match PP in:
• Flexibility
• Durability
However, they carry a cost premium of roughly three to four times the per-unit price of conventional plastic.
This cost gap is the primary commercial barrier.
It narrows as biopolymer production scales, but remains material in most market segments today.
The environmental case for compostable polymer straws over PP is also conditional.
Lifecycle emissions at the production stage are generally lower for plant-derived polymers, but the end-of-life benefit only materialises when appropriate composting infrastructure is available.
In a landfill, a PLA straw degrades very slowly, much like conventional plastic.
Compostable Polymer Straws vs. Reusable Straw Formats
Metal, glass, and silicone straws are reusable and carry low per-use lifecycle impacts over time.
For individual consumers, they represent a credible low-waste option.
For high-volume foodservice operators, however, reusable straws introduce:
• Hygiene management requirements
• Cleaning costs
• Logistical complexity
These factors are difficult to scale across mass foodservice operations.
Compostable Polymer Straws vs. Natural and Plant-Fibre Formats
Wheat, reed, grass, sugarcane bagasse, and bamboo straws are minimally processed natural materials.
These formats:
• Are naturally home compostable
• Avoid the certification complexity of engineered polymers
• Carry strong sustainability positioning
Their limitations include:
• Performance inconsistency
• Susceptibility to moisture
• Limited shape versatility
• Supply chain concentration in specific agricultural regions
They occupy a distinct niche rather than competing across the full straw market.
1.4 Compostable Polymer Straws — Manufacturing Methods
Compostable polymer straws are produced using extrusion, the same core process used for conventional plastic straws.
The process follows several stages:
• Biopolymer pellets (PLA, PHA, or blends) are fed into an extrusion machine
• The material is melted under controlled heat and pressure
• The molten polymer is forced through a shaped die to create a continuous tube
• The tube is cooled using a water bath or air cooling system
• The tube passes through a traction unit
• The final straw is cut to specified lengths
The extrusion process is well understood, but biopolymers introduce processing sensitivities that require adapted equipment.
PLA in particular has a narrow processing window and requires specially designed screw geometry to avoid degradation during melt.
Flexible straws require a secondary step where a bending machine creates the corrugated section.
For straws intended for hot beverages, a crystallisation step can be added to increase the heat resistance of PLA, which otherwise softens at relatively low temperatures.
These processing requirements mean that not all straw manufacturers can simply switch from PP to biopolymer feedstocks without equipment investment.
This has important implications for supply chain structure and market entry, which are covered in Chapter 5.
1.5 Compostable Polymer Straws — Key Performance Requirements
To be commercially deployable, a compostable polymer straw must meet all of the following requirements simultaneously:
Structural integrity: The straw must not collapse, kink, or soften during normal use. Target tensile strength is 60 to 73 MPa, with elongation of approximately 33% to 35% to ensure flexibility without brittleness.
Thermal stability: The straw must maintain its shape in both cold drinks and hot drinks. Performance is typically tested by hot-water immersion at 85°C for 30 minutes.
Surface hydrophobicity: To resist liquid absorption and maintain mouth sensation, the straw surface should achieve a water contact angle of 90° to 120°.
Taste neutrality: The straw must not impart any flavour to the drink, a requirement that rules out certain natural fibre formats and processing additives.
Food contact safety: The straw must comply with relevant food contact material regulations, including FDA requirements in the United States and relevant EU regulations in Europe.
Verified compostability: The finished product must carry certification to EN 13432, ASTM D6400, or an equivalent standard, depending on target market.
Shelf life: The straw must remain structurally stable in storage and packaging for a commercially viable period, typically 12 to 24 months, without premature degradation.
Meeting all of these requirements simultaneously, at a price point that is commercially viable for foodservice buyers, is the central engineering and commercial challenge this market is built around.
Compostable Polymer Straws — Market Definition and Sizing
2.1 Compostable Polymer Straws — Market Definition
This report sizes the global market for compostable polymer-based drinking straws sold as finished products to foodservice operators, institutional buyers, and retailers.
The materials in scope are
PLA (polylactic acid),
PHA (polyhydroxyalkanoates),
PBS (polybutylene succinate) blends, and
polymer-composite plant-fibre straws where a biopolymer binder is a material component of the product.
Paper straws are excluded from the core market sizing. While paper is the largest category in the broader eco-friendly straw market, it represents a distinct pulp-and-paper supply chain rather than a polymer bioplastics market. Paper straws market is covered in this report as the primary competitive reference.
Reusable straw formats (metal, glass, silicone) are noted for context but excluded from sizing.
This scope distinction matters because published market research on straws varies enormously depending on what is included.
Estimates for the total global straw market range from $3.8 billion to $26 billion depending on whether integrated industrial packaging (straws attached to juice cartons) is counted alongside consumer-facing drinking straws.
Estimates for the biodegradable straw market typically bundle paper, bamboo, and polymer straws into a single figure.
No publicly available source sizes the compostable polymer straw market exactly as scoped in this report.
The figures presented below are derived from available data using two complementary approaches.
2.2 Approaches to Sizing the Compostable Polymer Straws Market
Because no single source reports the compostable polymer straw market directly, we use two approaches to arrive at a consensus range. Both draw on third-party market data, and both are transparent about their assumptions and limitations.
Approach 1: Extracting the Polymer Share from the Biodegradable Straw Market
The most granular available data comes from Dataintelo’s biodegradable straw report, which values the global biodegradable straw market at $1.8 billion in 2025. This total includes paper, bamboo, PLA, PHA, and other biodegradable formats.
Dataintelo provides material-level shares in the global biodegradable straw market:
PLA holds 26.8% (approximately $482 million)
PHA holds 5.2% (approximately $94 million).
Together, these two polymer categories account for $576 million.
Adding conservative estimates for PBS/blends ($15M to $30M) and polymer-composite plant-fibre formats ($20M to $40M), which Dataintelo does not break out separately, produces a range of $611 million to $646 million.
Approach 2: Using the Paper Straw Market as a Sizing Anchor
Paper straws have better-documented market data across multiple independent sources.
Fortune Business Insights values the consumer-facing paper straw market at $1.66 billion (2025)
Global Growth Insights estimates $1.03 billion at converter level.
Using a working estimate of $1.0B to $1.3B for the biodegradable-positioned paper straw segment, and applying the polymer-to-paper ratio derived from Dataintelo’s material shares (approximately 0.55 to 0.60), implies a polymer straw market of $550M to $780M before adding PBS and plant-fibre composites.
This approach is less precise because it layers multiple estimates, but it uses an independent primary input (paper straw data from Fortune and GGI) rather than relying solely on Dataintelo.
Its central tendency clusters around $620 million to $700 million.
Insight: The two approaches overlap in the $620M to $646M zone. Where they diverge, Approach 2 pulls the upper bound higher, which suggests that independent paper straw data points to a biodegradable market somewhat larger than Dataintelo’s $1.8B figure. This means our polymer estimate is more likely to be understated than overstated.
2.3 Compostable Polymer Straws — Global Market Size 2025
The global compostable polymer straw market is estimated at $600 million to $700 million in 2025, with a central estimate of $640 million.
2.4 Compostable Polymer Straws — Market Forecast 2025 to 2035
The estimated CAGR for the compostable polymer straw market is 13.0% over the period 2025 to 2035.
No published source provides a growth rate for compostable polymer straws as defined in this report. This CAGR is derived by blending the individual growth rates of each material segment (PLA, PHA, PBS/blends, and polymer-composite plant-fibre), weighted by their estimated 2025 share of the market. The material-level growth rates and weightings are detailed in Chapter 3.
A 13% CAGR positions this market as growing meaningfully faster than the broader straw market (estimated at 6 to 7% CAGR across all materials) but slower than the most aggressive published forecasts for biodegradable straws, which often include paper straw growth in their headline figures.
The rate reflects three dynamics working simultaneously:
Regulatory expansion. Single-use plastic straw bans continue to spread at national, state, and city levels. Each new ban converts a portion of conventional plastic straw demand into alternatives, of which compostable polymer straws capture a share.
Cost convergence. The price premium for compostable polymer straws over paper is narrowing as PLA production scales globally, particularly in China. This progressively unlocks cost-sensitive segments that currently default to paper.
Material diversification. PHA and PBS-blend straws are scaling from a small base at growth rates well above the market average. These materials are opening segments (such as the EU market) where PLA faces regulatory barriers, adding growth that did not previously exist.
The rate is moderated by the maturity of PLA, which accounts for the majority of today’s market and grows at a lower rate than the emerging materials.
It is also moderated by the continued dominance of paper straws as the default low-cost alternative in most markets, which limits the pace at which polymer straws can gain share.
Global Compostable Polymer Straws Market Forecast
| Year | Estimated Global Market Size |
|---|---|
| 2025 (base) | $640 million |
| 2030 | ~$1.2 billion |
| 2035 | ~$2.2 billion |
The market roughly doubles between 2025 and 2030, then nearly doubles again between 2030 and 2035. The acceleration in absolute value added per year reflects the compounding nature of the growth rate applied to an expanding base.
Regional Compostable Polymer Straws Growth Rates
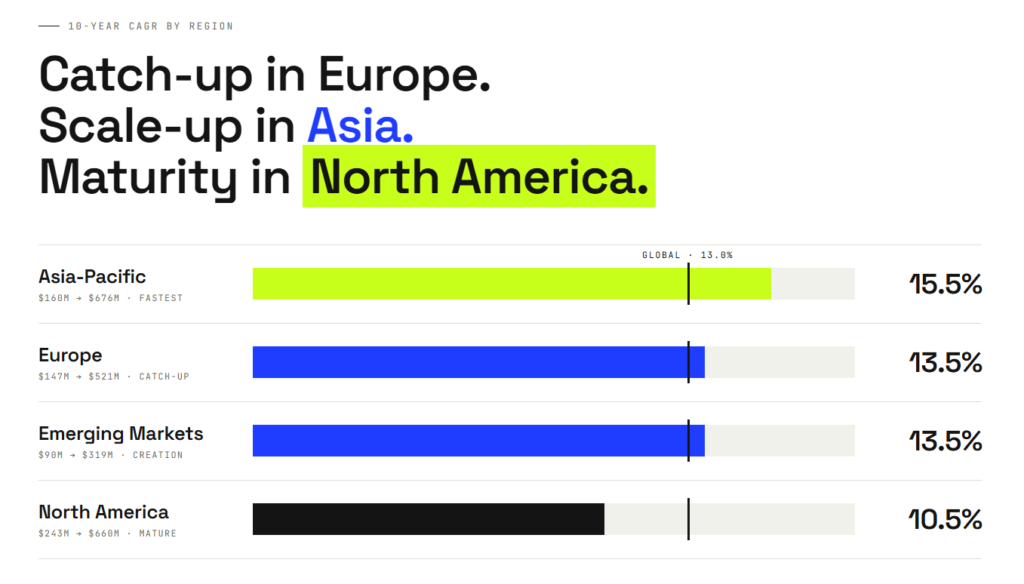
Growth rates differ by region based on regulatory maturity, production proximity, and the stage of transition from conventional plastic.
| Region | CAGR (2025 to 2035) | Growth Profile |
|---|---|---|
| North America | 10.5% | Steady growth from the largest and most mature base. Major foodservice chains have already transitioned; growth is incremental. |
| Europe | 13.5% | Catch-up growth. PLA is suppressed by the EU SUP Directive, but PHA and PBS alternatives are scaling. Any regulatory clarification favouring certified compostable polymers would accelerate this rate. |
| Asia-Pacific | 15.5% | Fastest-growing region. PLA production expansion in China, broadening regulation, and structural foodservice growth reinforce each other. |
| Emerging Markets | 13.5% | Market creation from a small base. Gulf hospitality drives premium adoption; Latin American regulation is expanding gradually. |
These regional CAGRs, when weighted by 2025 regional shares (Chapter 2.5), produce a blended global rate of 13.0%.
2.5 Compostable Polymer Straws — Regional Market Analysis
Regional shares of the compostable polymer straws market are estimated by evaluating four factors for each region:
the regulatory position of polymer straws,
production proximity and cost position,
foodservice market structure and willingness to pay, and
the stage of transition from conventional plastic.
Regional shares are applied to the $640 million global market, and cross-checked against independent biodegradable straw and paper straw market data.
| Region | 2025 Share | Market Size (2025) | CAGR | Estimated Market Size (2030) | Estimated Market Size (2035) |
|---|---|---|---|---|---|
| North America | 38% | ~$243M | 10.5% | $400M | $660M |
| Europe | 23% | ~$147M | 13.5% | $277M | $521M |
| Asia-Pacific | 25% | $160M | 15.5% | $329M | $676M |
| Emerging Markets | 14% | ~$90M | 13.5% | $169M | $319M |
| Global | 100% | ~$640M | 13.0% | $1,175M | $2,176M |
North America: 38% of Global Compostable Polymer Straws Market ($243M)
North America is the largest regional market for compostable polymer straws.
In North America, PLA is fully compliant under BPI certification (ASTM D6400), and no US or Canadian regulation restricts compostable polymer straws.
The region’s foodservice market is dominated by large chains with centralised sustainability procurement and the purchasing power to absorb the polymer cost premium.
Per-unit straw prices are higher than in other regions, meaning North America’s value share exceeds its volume share.
At a CAGR of 10.5%, North America’s compostable polymer-based straws market grows steadily but below the global average.
By 2030, the market will reach $400 million. By 2035, it will reach $660 million.
Europe: 23% of Global Compostable Polymer Straws Market ($147M)
Europe’s polymer straw market is constrained by the EU Single-Use Plastics Directive, which classifies PLA as plastic and restricts its use in straw applications. This is the single most important factor shaping the region.
Paper holds a dominant share of Europe’s eco-friendly straw segment as a result.
Growth comes from PHA and PBS-blend straws gaining compliant pathways in both the EU and UK, and from non-EU, non-UK European markets (Switzerland, Norway, Balkans) where PLA remains accessible.
Italy’s exemption for EN 13432-certified compostable bioplastics also contributes, though this exemption is subject to EU infringement proceedings.
At a CAGR of 13.5%, Europe grows above the global average. This reflects catch-up dynamics: the market is growing from a base that has been suppressed by regulation, and the entry of compliant materials progressively unlocks demand.
By 2030, the market will reach $277 million. By 2035, it will reach $521 million.
Asia-Pacific: 25% of Global Compostable Polymer Straws Market ($160M)
Asia-Pacific is the fastest-growing regional market and is defined by one structural advantage: China is the world’s largest PLA production hub.
Local production reduces the polymer cost premium relative to paper, making PLA straws more competitive in the Chinese domestic market than anywhere else.
China’s progressive plastic ban, expanding from Tier 1 cities, is creating sustained demand.
Japan and South Korea contribute as premium foodservice markets.
India’s single-use plastic ban adds long-term potential, though enforcement remains uneven.
At a CAGR of 15.5%, Asia-Pacific is the fastest-growing region in the global compostable polymer straw market.
As per our forecast, by 2030, the market reaches $329 million. By 2035, it will reach $676 million.
Emerging Markets: 14% of Global Compostable Polymer Straws Market ($90M)
Emerging markets (Latin America and Middle East & Africa combined) represent the smallest but growing segment.
The Gulf hospitality sector (UAE, Saudi Arabia, Qatar) drives disproportionate polymer straw adoption through premium hotels, airlines, and restaurants where performance and aesthetics are valued over cost.
Latin America is predominantly cost-sensitive and paper-dominant, with early-stage regulation in Colombia, Chile, and parts of Brazil.
At a CAGR of 13.5%, emerging markets grow in line with Europe but for different reasons: market creation rather than catch-up.
By 2035, emerging markets are estimated at approximately $319 million.
Compostable Polymer-based Straws — Regional Market Share Migration 2025 to 2035
| Region | 2025 Share | 2030 Share | 2035 Share | Direction |
|---|---|---|---|---|
| North America | 38% | 34% | 30% | Declining (mature, slowest growth) |
| Europe | 23% | 24% | 24% | Stable (catch-up growth offsets smaller base) |
| Asia-Pacific | 25% |
3. Compostable Polymer-based Straws – Material Profiles and Market Sizes
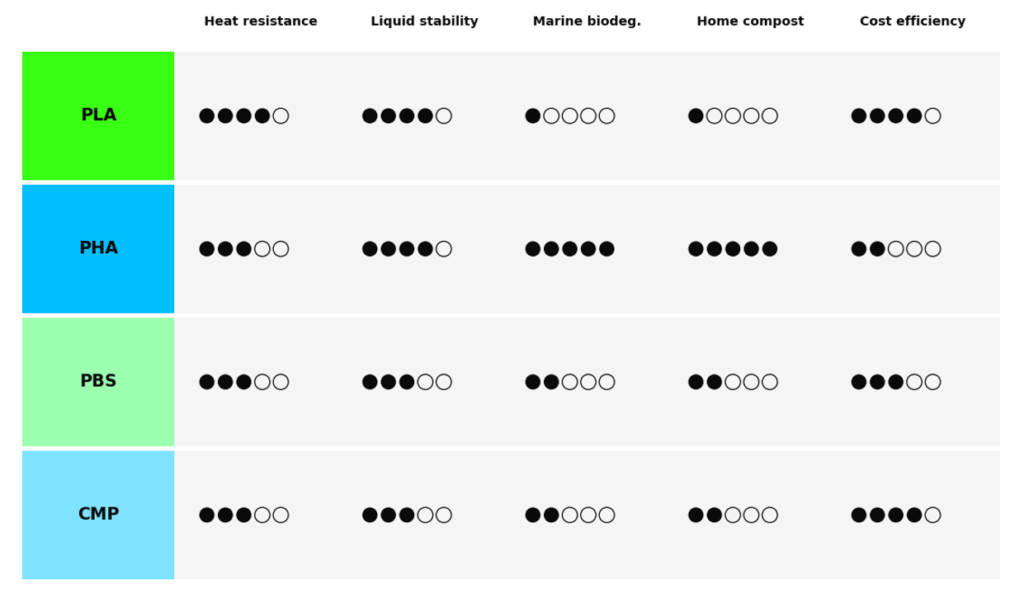
The global compostable polymer straw market is built on four material categories: PLA, PHA, PBS/blends, and polymer-composite plant-fibre straws.
Each occupies a distinct position defined by cost, performance, regulatory access, and production maturity.
PLA is the commercial incumbent.
It accounts for approximately 76% of the global market, benefits from the largest production base, the lowest resin cost among biopolymers, and a tactile experience closest to conventional plastic.
PLA dominates in every region except Europe, where it is banned under the EU Single-Use Plastics Directive and restricted in the UK.
PHA is the fastest-growing material at 19.3% CAGR.
Its certified marine biodegradability and home compostability give it a regulatory and environmental profile that no other polymer can match.
PHA’s market is concentrated in Europe, where PLA’s ban has created structural demand for a compliant polymer alternative.
PBS functions primarily as a blend component rather than a standalone straw material.
Its value lies in improving the flexibility of PLA and the processability of PHA, making it central to formulation strategies aimed at meeting both performance and regulatory requirements.
Europe is the leading market for PBS-blend straw innovation.
Plant-fibre polymer composites are the smallest segment.
They combine agricultural feedstocks (sugarcane bagasse, wheat straw, rice) with biopolymer binders and position on home compostability and natural-material credentials. Production is concentrated in Asia-Pacific.
The single most important structural feature of this market is the regulatory divide between Europe and the rest of the world.
In North America, Asia-Pacific, and Emerging Markets, PLA is unrestricted and accounts for 88% or more of polymer straw sales.
In Europe, PLA is banned in both the EU and the UK, making PHA the largest polymer straw material and creating a uniquely diversified material mix.
This regulatory divide shapes every aspect of the material landscape covered in this chapter: pricing, demand, supply chain development, and investment flows.
| Material | Global Market (2025) | Share | CAGR (2025 to 2035) | Defining Characteristic |
|---|---|---|---|---|
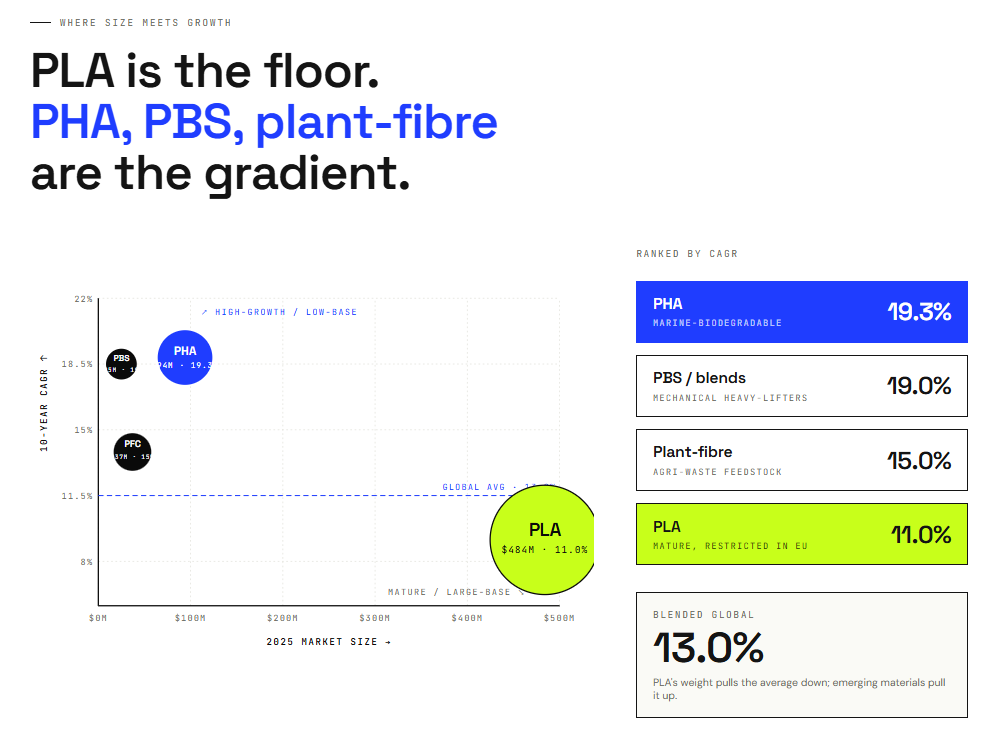
| PLA | $484M | 75.6% | 11.0% | Lowest cost, largest scale, banned in EU and UK |
| PHA | $94M | 14.7% | 19.3% | Marine-biodegradable, home-compostable, EU compliance potential |
| PBS/blends | $25M | 3.9% | 19.0% | Blend modifier for flexibility and processability |
| Plant-fibre composites | $37M | 5.8% | 15.0% | Agricultural waste feedstock, home-compostable |
| Total | $640M | 100% | 13.0% |
3.1 PLA (Polylactic Acid) Straws: Properties, Pricing, and Market Size
3.1.1 PLA Straw Properties and Processing
PLA (polylactic acid) is a thermoplastic biopolymer derived from renewable feedstocks, typically corn starch, sugarcane, or cassava.
It is the most commercially established compostable polymer used in straw manufacturing and offers a tactile experience close to conventional plastic, with good clarity, rigidity, and a smooth mouthfeel.
Key mechanical properties for straw applications include:
tensile strength suitable for structural integrity during use,
FDA approval for food contact, and
compatibility with standard extrusion processing at melt temperatures of 180 to 200°C.
PLA pellets are hygroscopic and must be dried before processing to prevent quality degradation.
Manufacturers switching production lines from PET or PP to PLA must purge equipment thoroughly, as residual PET will not melt at PLA’s lower operating temperatures.
PLA’s primary functional limitation is thermal sensitivity.
Standard PLA straws soften at approximately 55°C (130°F), which makes them unsuitable for hot beverages without a crystallisation step to improve heat resistance.
Pure PLA is also brittle; manufacturers frequently blend it with other biopolymers such as amorphous PHA (aPHA) or PBS to improve flexibility for bendy straw designs.
3.1.2 Why PLA Straws Are Banned in the European Union
Despite being bio-based and industrially compostable, single-use PLA straws are banned across the European Union under the Single-Use Plastics Directive (EU) 2019/904.
The Directive defines “plastic” as any material consisting of a polymer that can function as a structural component, and explicitly covers bio-based and biodegradable plastics.
PLA does not qualify for the Directive’s exemption for “natural polymers that have not been chemically modified” because it is produced through industrial fermentation and polymerisation.
As of July 2021, PLA straws cannot be placed on the market in EU member states.
Insight: This creates a paradox. The world’s most regulated market for single-use plastics has effectively banned the most commercially mature compostable polymer alternative.
The result is that Europe’s eco-friendly straw market is dominated by paper, while polymer alternatives like PHA and PBS must demonstrate a different compliance pathway.
The UK implemented its own ban on single-use plastic straws in England from October 2020, with Scotland and Wales following with similar restrictions.
UK government guidance explicitly includes compostable plastics such as PLA within the scope of the ban.
This means that PLA straws are restricted in both the EU (27 member states) and the UK, which together represent the vast majority of the European market by value.
The remaining European market for PLA straws is limited to Italy (which transposed the SUP Directive with an exemption for certified compostable bioplastics under EN 13432, though the European Commission has initiated infringement proceedings against this exemption), non-EU and non-UK markets (Switzerland, Norway, Iceland, and Balkan states), and residual volumes in EU member states where enforcement has been gradual.
3.1.3 PLA Pricing: Cost per Kilogram
PLA resin pricing varies significantly by region, driven by production proximity, import costs, and regulatory pressures.
| Region | PLA resin price ($/kg, 2025) | Note |
|---|---|---|
| North America | $2.39 | Closest to NatureWorks (largest Western producer) |
| Northeast Asia | $2.49 | Chinese domestic production drives competitive pricing |
| Southeast Asia | $2.86 | Regional hub with growing capacity |
| Europe | $3.49 | Highest price; zero domestic PLA production, all imported |
At finished-straw level, PLA straws carry a cost premium of approximately 3 to 4× over conventional polypropylene straws, with bulk pricing to foodservice buyers typically in the range of $0.02 to $0.03 per straw depending on region and order volume.
3.1.4 PLA Straw Market Size: Global and Regional Demand
PLA is the largest material segment in the compostable polymer straw market, accounting for approximately 75.6% of global market value.
Global PLA Straw Market Size: $484M
| Region | 2025 Value | Share of Global PLA Market |
|---|---|---|
| North America | $225M | 46.5% |
| Asia-Pacific | $140M | 28.9% |
| Emerging Markets | $81M | 16.7% |
| Europe | $38M | 7.9% |
| Global | $484M | 100% |
North America leads with nearly half of global PLA straw demand.
PLA is unrestricted, BPI-certified under ASTM D6400, and the default polymer straw material for US and Canadian foodservice chains.
The absence of any regulatory restriction on PLA, combined with premium foodservice pricing, makes North America the dominant PLA market globally.
Asia-Pacific is the second-largest market.
China’s position as the world’s largest PLA production hub gives the region a structural cost advantage, and domestic PLA straw consumption is growing alongside China’s progressive plastic ban.
PLA is explicitly supported under China’s national standard for biodegradable straws (GB/T 41008-2021).
Emerging Markets are PLA-dominant because PLA is the most commercially available and affordable polymer straw material in regions without domestic PHA or PBS production.
Europe has the smallest PLA straw market of any region, at just $38M (7.9% of global PLA).
This reflects the combined effect of the EU SUP Directive ban and the UK’s own single-use plastic straw restrictions.
The $38M consists primarily of sales under Italy’s compostable bioplastic exemption (which is legally precarious), non-EU and non-UK European markets, and residual enforcement-gap volumes.
Insight: PLA’s European market share (25.9% of the regional polymer market) is less than one-third of what it is in any other region (88% or higher).
This is entirely a regulatory effect.
PLA is functionally identical regardless of geography.
The performance and cost arguments for PLA are the same in London as in New York.
The difference is that European law treats PLA as plastic.
PLA straw CAGR: 11.0% (2025 to 2035). Growth is driven by ongoing regulatory expansion of plastic straw bans in unrestricted markets (particularly APAC), production scale-up reducing costs, and PLA’s established position as the default polymer straw material globally. The rate is moderated by PLA’s locked-out position in Europe.
3.2 PHA (Polyhydroxyalkanoate) Straws: Properties, Pricing, and Market Size
3.2.1 PHA Straw Properties and Processing
PHA (polyhydroxyalkanoates) are 100% bio-based polyesters produced through microbial fermentation of renewable carbon sources such as plant oils, sugars, or upcycled food waste.
Unlike PLA, PHA is not synthesised through chemical polymerisation but is produced directly by microorganisms as an intracellular energy store, which gives it a distinct regulatory and environmental profile.
PHA straws match the thermal resistance of conventional polypropylene.
The remain rigid in temperatures up to 85°C (185°F).
This is a significant advantage over PLA, which softens at roughly 55°C.
PHA does not degrade or soften during use regardless of beverage type, and its mouthfeel is described as nearly identical to traditional plastic.
For manufacturers, PHA acts as a drop-in resin compatible with standard PP extrusion equipment, and requires only minor temperature adjustments and no new capital expenditure.
Production scrap can be re-granulated and fed back into the line.
PHA resins have a stable shelf life of 12 to 18 months.
3.2.2 PHA Regulatory Advantage: Marine Biodegradability and EU Compliance
PHA’s most important commercial differentiator is its end-of-life performance.
It is the only biopolymer that is certified for marine biodegradability (TÜV Austria OK biodegradable MARINE, ASTM D6691), completely mineralising into CO2, water, and biomass without leaving persistent microplastics.
Many PHA grades are also certified for home composting (TÜV OK compost HOME), which PLA cannot achieve.
This creates a potential EU SUP compliance pathway.
There is ongoing regulatory debate about whether PHA qualifies as a “natural, non-chemically modified polymer” under the Directive, since it is produced biologically rather than through industrial chemical synthesis.
Some interpretations of the SUP framework would exempt PHA from the straw ban.
This regulatory ambiguity is itself a commercial driver: European buyers seeking a polymer straw alternative to paper are turning to PHA as the material most likely to achieve compliant status.
PHA is FDA and EFSA compliant for direct food contact and is inherently PFAS-free.
3.2.3 PHA Straw Pricing: Current Cost and Scale-Up Trajectory
PHA remains significantly more expensive than PLA, which is the primary barrier to mass-market adoption.
| Material | Indicative resin price (€/kg, 2025) |
|---|---|
| Conventional PP | €0.90 to €1.20 |
| PLA | €2.50 to €3.00 |
| PBS | ~€4.00 |
| PHA (standard grades) | ~€6.00 |
| PHA (starch-based grades) | €7.00 to €10.00 |
PHA production costs are 20% to 80% higher than conventional plastics because production has not yet achieved full economies of scale.
Industry analysts suggest a price point below $4.00/kg is necessary for broad market competitiveness.
Current production capacity (approximately 76,000 MT globally in 2024 across all PHA applications) is expanding, but remains small relative to PLA (385,000 MT).
3.2.4 PHA Straw Market Size: Global and Regional Demand
PHA is the fastest-growing material in the compostable polymer straw market, accounting for approximately 14.7% of global market value and growing at 19.3% CAGR.
Global PHA Straw Market Size: $94M
| Region | 2025 Value | Share of Global PHA Market |
|---|---|---|
| Europe | $70M | 74.5% |
| North America | $11M | 11.7% |
| Asia-Pacific | $7M | 7.4% |
| Emerging Markets | $6M | 6.4% |
| Global | $94M | 100% |
Europe dominates PHA straw demand, accounting for nearly three-quarters of global sales.
This is the inverse of every other material and is a direct consequence of the EU SUP Directive and UK straw bans: with PLA banned across both the EU and UK, PHA is the primary polymer straw material with a viable compliance pathway.
European foodservice operators and distributors seeking a polymer alternative to paper have limited options, and PHA’s marine biodegradability and home compostability make it the strongest regulatory candidate.
This concentration is consistent with MarketsandMarkets data showing Europe holding 57.4% of the total global PHA market value across all applications.
North America is the second market, where PHA is positioned as a premium, marine-biodegradable option alongside unrestricted PLA.
PHA adoption in North America is driven by brand sustainability positioning rather than regulatory necessity.
Asia-Pacific has PHA production capacity (Kaneka in Japan, expanding facilities in China) but domestic straw demand remains early-stage because PLA is cheaper and faces no regulatory restrictions.
PHA straw CAGR: 19.3% (2025 to 2035). PHA is the fastest-growing segment in the market, driven by European regulatory demand, global production capacity expansion, and declining costs as economies of scale develop.
3.3 PBS and Polymer Blend Straws: Properties, Pricing, and Market Size
3.3.1 PBS Properties and Processing for Straw Applications
PBS (polybutylene succinate) is an aliphatic polyester valued for its balanced mechanical properties and excellent biodegradability.
It is a white crystalline thermoplastic with a melting point between 90 and 120°C, which makes it thermally stable across both cold and hot beverage applications.
PBS has mechanical properties comparable to polyethylene, with exceptional ductility: elongation at break often exceeds 300%, making it far more flexible than PLA.
Its primary limitation in pure form is excessive softness and low melt viscosity.
In straw applications, PBS is used almost exclusively as a blend component rather than a standalone material.
Processing uses standard twin-screw extrusion at temperatures of 165 to 180°C.
Both PBS and its blend partners (PLA, PHA) are hygroscopic and require drying before processing.
3.3.2 PBS Blend Strategies: PBS/PLA and PBS/PHA Formulations
PBS’s commercial value in the straw market lies in what it does to other materials when blended.
PBS/PLA blends: Adding 20% PBS by weight transforms PLA from brittle to ductile, increasing elongation at break from 25% to over 200%.
This is critical for flexible and bendy straw designs where pure PLA would crack.
The blend creates a “sea-island” microstructure where PBS droplets act as toughening agents within the PLA matrix.
PBS/PHA blends: PBS improves the processability and hydrophobicity of PHA, which can be rigid and brittle in pure form.
Manufacturers use compatibilisers such as dicumyl peroxide (DCP) to improve interfacial adhesion between the two polymers, which increases elongation by approximately 45%.
PBS/PHA blends also degrade faster in composting and marine environments than pure PBS.
Insight: PBS blend strategies are increasingly important for the EU market, where formulators are developing PBS/PHA straw compositions specifically designed to navigate the SUP Directive’s restrictions while delivering the flexibility and durability that pure PHA or PLA alone cannot achieve.
3.3.3 PBS Straw Pricing: Cost Position
PBS occupies a middle position between PLA and PHA in pricing, at approximately €4.00/kg globally and around $3.50/kg in Asia-Pacific where production costs are lowest.
This makes PBS blends a cost-effective way to improve PLA or PHA straw performance without the full cost penalty of using PHA alone.
3.3.4 PBS Straw Market Size: Global and Regional Demand
PBS and PBS-blend straws represent the smallest material segment, estimated at approximately $25 million globally in 2025 (3.9% of the polymer straw market).
This figure should be treated as an order-of-magnitude estimate.
Global PBS Straw Market Size: $25M
| Region | 2025 Value | Share of Global PBS Market |
|---|---|---|
| Europe | $15M | 60% |
| Asia-Pacific | $5M | 20% |
| North America | $3M | 12% |
| Emerging Markets | $2M | 8% |
| Global | $25M | 100% |
Europe leads PBS straw demand because PBS-blend formulation is driven primarily by the need to create EU-compliant polymer straws.
PBS/PHA blends are being developed specifically to combine PHA’s regulatory advantages with PBS’s flexibility and processability.
This formulation innovation is concentrated in European R&D and manufacturing, where the regulatory demand is strongest.
Asia-Pacific is second, reflecting the concentration of PBS production (Mitsubishi Chemical, Chinese manufacturers) and the co-location advantage with PLA for PBS/PLA blend development.
PBS straw CAGR: approximately 19% (2025 to 2035), driven by growing demand for blend formulations across both the EU compliance pathway and the broader performance improvement of PLA and PHA straw products.
3.4 Plant-Fibre Composite Straws: Sources, Performance, and Market Size
3.4.1 Plant-Fibre Straw Sources and Processing Methods
Plant-fibre composite straws use agricultural materials as reinforcement within a biopolymer matrix.
The key feedstocks are sugarcane bagasse (the fibrous residue after juice extraction), wheat straw (containing 38 to 45% cellulose), grass and reed (particularly Lepironia, common in Asia and Oceania), and rice flour (typically bound with tapioca starch).
Processing methods to manufacture plant-fibre straws vary by format.
- Wheat straw particulates are melt-blended with PLA or PP through injection moulding.
- Grass and reed straws require minimal processing: washing, trimming, hollowing, drying, and sterilisation with no chemical additives.
- Rice-based straws use a puffing extrusion process to shape a rice-and-starch dough into cylindrical tubes.
This report’s scope covers only formats where a biopolymer binder is a material component.
Pure pressed-fibre straws without polymer content are excluded for consistency with the paper straw exclusion.
3.4.2 Plant-Fibre Straw Performance: Where They Win and Where They Lose
Strengths:
- Plant-fibre composite straws offer structural integrity that significantly outperforms paper.
- Rice straws last 2 to 3 hours in hot drinks and up to 10 hours in cold beverages.
- Sugarcane bagasse straws do not become soggy.
- Grass straws provide a plastic-like feel and remain durable for at least 8 hours.
- Most formats are home-compostable and marine-degradable, biodegrading within 90 to 180 days.
- Rice straws are edible.
Limitations:
- Performance consistency varies between batches due to natural feedstock variability.
- Shape versatility is limited compared to engineered polymers (bendy straw designs are difficult).
- Grass straws are absorbent and may take on beverage colour.
- Supply chains are concentrated in specific agricultural regions, which creates scaling constraints.
3.4.3 Plant-Fibre Straw Costs and Supply Chain
Raw material costs are low due to the abundance of agricultural waste.
Southeast Asia generates approximately 210 million MT of rice straw annually.
However, the supply chain faces challenges around collection, transport, and storage logistics, particularly in rural areas with labour shortages.
Using agricultural waste as a filler is a key strategy to reduce the unit cost of more expensive biopolymer binders.
Finished-product pricing is generally more expensive than plastic but increasingly competitive with paper as manufacturing scales.
3.4.4 Plant-Fibre Composite Straw Market Size: Global and Regional Demand
Plant-fibre polymer composites are estimated at $37 million globally in 2025 (5.8% of the polymer straw market).
This figure covers only polymer-composite formats and should be treated as an indicative estimate.
Global Plant-Fibre Composite Straw Market Size: $37M
| Region | 2025 Value | Share of Global Plant-Fibre Market |
|---|---|---|
| Europe | $24M | 64.9% |
| Asia-Pacific | $8M | 21.6% |
| North America | $4M | 10.8% |
| Emerging Markets | $1M | 2.7% |
| Global | $37M | 100% |
Europe leads plant-fibre composite straw demand.
This is driven by the same regulatory dynamic affecting PHA and PBS: with PLA banned, European buyers are exploring every available polymer-alternative format, including plant-fibre composites that combine agricultural materials with compliant biopolymer binders.
Premium green hospitality and dining applications in Western Europe are early adopters.
These products also have strong positioning as home-compostable and natural-material formats, which aligns with European consumer preferences.
Asia-Pacific is second on the strength of abundant feedstock, low processing costs, and a concentration of plant-fibre straw producers in Vietnam, India, and China.
While Asia-Pacific leads global production volume of plant-based straws broadly (45% of global unit volume), the polymer-composite subset that falls within this report’s scope is smaller because much of APAC’s plant-fibre straw production is pure fibre without a polymer binder.
Plant-fibre composite straw CAGR: approximately 15% (2025 to 2035), driven by cost advantages from agricultural waste feedstocks and growing demand for home-compostable and marine-degradable formats.
Global Compostable Polymer-based Straws Market: By Material and Region (2025)
| Region | PLA | PHA | PBS/blends | Plant-Fibre | Total |
|---|---|---|---|---|---|
| North America | $225M | $11M | $3M | $4M | $243M |
| Europe | $38M | $70M | $15M | $24M | $147M |
| Asia-Pacific | $140M | $7M | $5M | $8M | $160M |
| Emerging Markets | $81M | $6M | $2M | $1M | $90M |
| Global | $484M | $94M | $25M | $37M | $640M |
Global Compostable Polymer-based Straws Market: Growth Rate by Material (2025 to 2035)
| Material | 2025 Market Size | CAGR (2025 to 2035) |
|---|---|---|
| PLA | $484M | 11.0% |
| PHA | $94M | 19.3% |
| PBS/blends | $25M | 19.0% |
| Plant-fibre composites | $37M | 15.0% |
| Global total | $640M | 13.0% |
3.5 Paper Straws: Performance, Costs, and Market Size
3.5.1 Why Paper Straws Dominate the Eco-Friendly Straw Market
Paper straws are the largest single category in the global eco-friendly straw market and the primary competitive reference for compostable polymer straws.
Paper’s dominance rests on three advantages.
- Regulatory fit: Paper is not classified as “plastic” under the EU Single-Use Plastics Directive or equivalent regulations globally. It is permitted in every major regulated market, while biopolymers like PLA are restricted in the EU.
- First-mover advantage: When plastic straw bans took effect, paper was the fastest available substitute. Foodservice chains with imminent compliance deadlines switched to paper because it was available at scale and from a broad supplier base.
- Cost position: Paper straws are cheaper than polymer alternatives, with bulk pricing generally ranging from $0.01 to $0.12 per unit, approximately 2 to 10 times the cost of conventional plastic ($0.005 to $0.02) but significantly below PLA and PHA pricing.
3.5.2 Paper Straw Weaknesses: Sogginess, PFAS Contamination, and User Experience
Despite market dominance, paper straws face significant and well-documented performance problems.
- Structural failure in liquid: Paper straws lose compressive strength rapidly during use and become limp and soggy before a customer finishes a drink. A 2025 US Executive Order cited “structural integrity failures,” noting paper straws break or disintegrate in hot drinks.
- PFAS contamination: A 2023 study found that many paper and bamboo straws contain PFAS (per- and polyfluoroalkyl substances), used as moisture-resistant coatings. PFAS are persistent environmental contaminants linked to adverse health outcomes. Certified compostable polymer straws are generally verified PFAS-free.
- Additional safety concerns: Research has identified migration of endocrine disruptors and suspected carcinogens from printed paper straws into beverages. In healthcare settings, paper straws have been linked to choking hazards.
3.5.3 Paper Straw Pricing and Production Costs
| Cost metric | Paper straws | Conventional plastic straws |
|---|---|---|
| Per-unit cost (bulk) | $0.01 to $0.12 | $0.005 to $0.02 |
| Cost premium vs. plastic | 2× to 10× | Baseline |
| Energy intensity vs. plastic | 4× higher | Baseline |
| Water intensity vs. plastic | 3× higher | Baseline |
Most businesses report a 2 to 3× cost increase when switching from plastic to paper.
US federal agencies cited a 400% cost premium for paper drinking straws over conventional plastic in 2025.
3.5.4 Are Paper Straws Truly Compostable? Industrial and Home Performance
Paper straws are widely marketed as eco-friendly, but their actual end-of-life performance is more nuanced than commonly assumed.
- Industrial composting: Paper straws typically decompose in 30 to 60 days in industrial facilities, which is faster than PLA (which requires temperatures above 58°C sustained for up to 180 days). On this metric, paper has a clearer disposal pathway.
- Home composting: Paper straws can decompose in home compost conditions, though performance varies depending on the coatings and wet-strength additives used. Many paper straws are chemically treated with wet-strength agents that slow decomposition and may leave residues.
- Recycling: Most paper straws are not recyclable because they are contaminated by food and drink residue or treated with chemical additives. The majority end up in general waste or incineration rather than recycling or composting streams.
Insight: The practical difference between paper and polymer straws in end-of-life outcomes is smaller than marketing suggests.
Paper decomposes faster in industrial composting, but both paper and PLA perform poorly in landfill.
PHA and PBS blends outperform both paper and PLA in home composting and marine environments.
The choice between paper and polymer on environmental grounds depends heavily on the available waste infrastructure, not on the material alone.
3.5.5 Paper Straw Market Size: Global Scale and Growth Trajectory
The consumer-facing paper straw market is estimated at approximately $1.5 billion to $1.7 billion in 2025 (central estimate: $1.6B), which is roughly 2.5 times the size of the compostable polymer straw market.
Global Paper Straw Market Size: $1.6B
| Region | 2025 Estimated Value | Share of Global Paper Straw Market |
|---|---|---|
| North America | $603M | 37.7% |
| Europe | $464M | 29.0% |
| Asia-Pacific | $373M | 23.3% |
| Emerging Markets | $160M | 10.0% |
| Global | $1,600M | 100% |
North America leads paper straw sales, driven by widespread adoption across foodservice chains.
Europe is second, where paper’s regulatory advantage under the SUP Directive gives it a structural preference over polymer alternatives.
Asia-Pacific is the fastest-growing regional paper straw market, with China producing over 32 billion units annually.
Paper straw market CAGR: approximately 9% (2025 to 2035).
Paper’s growth rate is below the compostable polymer straw CAGR of 12.9%, meaning polymer is gradually gaining share against paper within the broader eco-friendly straw market.
However, paper’s absolute market dominance persists through the forecast period: by 2035, paper straws are still projected to be approximately 1.7 times the size of the polymer straw market.
4. Compostable Polymer-based Straws – Demand Drivers and Regulatory Landscape
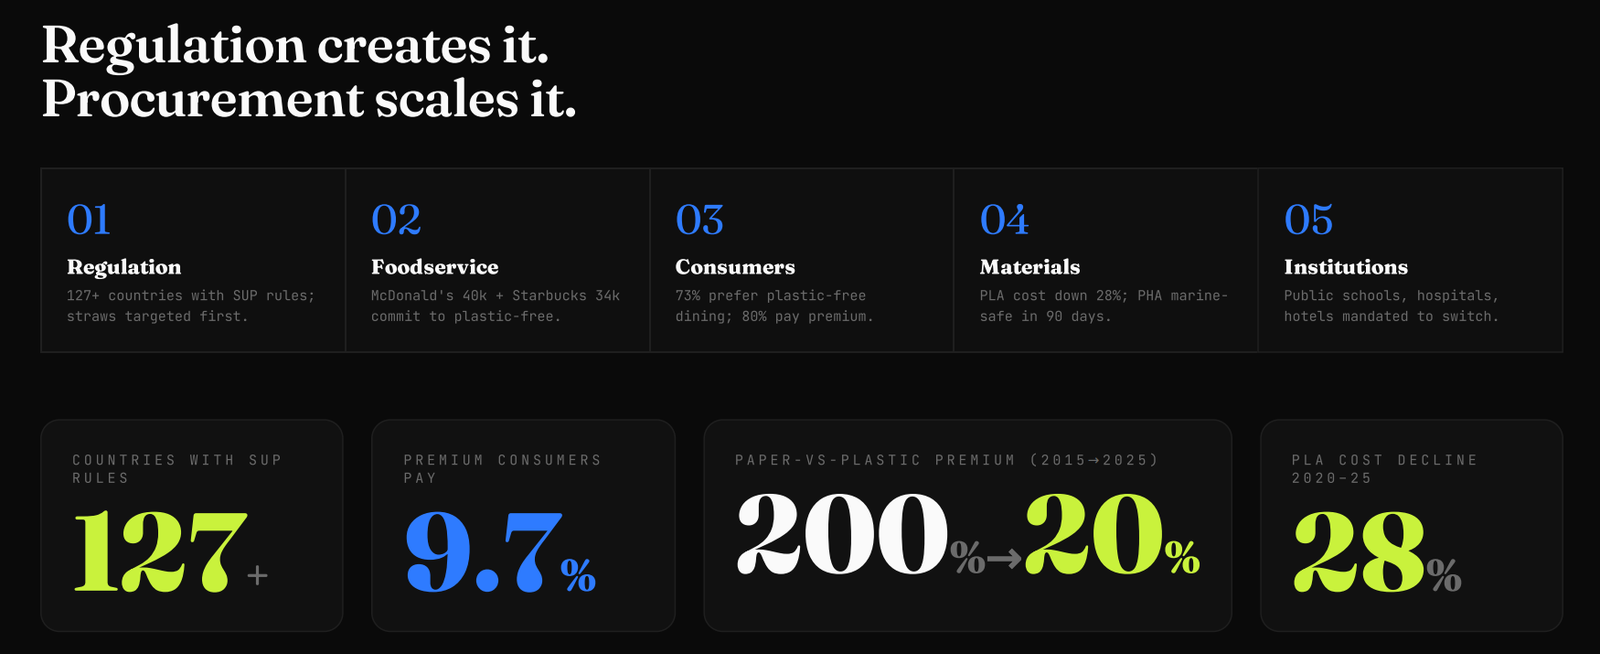
4.1 What Is Driving Demand for Compostable Polymer Straws?
Five forces drive demand for compostable polymer straws globally.
They operate in sequence:
- regulation creates the initial market,
- foodservice commitments generate volume,
- consumer preference sustains it,
- material innovation removes barriers, and
- institutional procurement adds a growing public-sector layer.
Regulatory Bans on Single-Use Plastic Straws
Legislation is the single most powerful demand driver for the compostable polymer-based straws market.
As of early 2026, more than 127 countries have enacted some form of single-use plastic regulation, with straws consistently among the first product categories targeted.
The EU Single-Use Plastics Directive, enforced since July 2021, created the largest single regulatory event by banning plastic straws across 27 member states.
Federal bans in Canada, India, and China followed.
In the United States, state and municipal bans in California, New York, Oregon, and Washington cover significant foodservice volume despite the absence of federal legislation.
Regulation also creates reputational pressure that drives voluntary switching in adjacent unregulated markets.
Foodservice Industry Sustainability Commitments
Voluntary pledges from global foodservice operators generate predictable, large-volume demand within the compostable polymer-based straws market.
- McDonald’s (approximately 40,000 restaurants) and Starbucks (34,000+ locations) have committed to eliminating plastic straws.
- Burger King, KFC, Costa Coffee, and Tim Hortons have made similar commitments.
- These commitments create a cascading effect through supplier and franchisee networks.
ESG reporting requirements are extending this dynamic to airlines (British Airways, Singapore Airlines), hotel groups (Marriott), and stadium operators.
Consumer Preference and Willingness to Pay
Consumer sentiment for eco-friendly straws operates independently of legislation.
Surveys from early 2026 indicate that over 73% of global consumers actively prefer establishments offering plastic-free dining.
80% are willing to pay an average premium of 9.7% for sustainable products.
Millennials and Generation Z represent the fastest-growing spending cohort and demonstrate measurable willingness to reward brands with genuine sustainability credentials.
Material Innovation and Cost Reduction
Advances in material science are reducing historical barriers in the compostable polymer-based straws market.
- The cost premium for paper straws over plastic has declined from over 200% in 2015 to 15 to 25% in high-volume contracts.
- PLA manufacturing costs declined by approximately 28% between 2020 and 2025.
- The emergence of PHA straws that biodegrade in marine environments within 90 days provides a “marine-safe” positioning that is highly attractive to coastal and hospitality venues.
- Innovation in PBS/PLA and PBS/PHA blends is expanding the range of straw formats that can meet both performance and regulatory requirements.
Institutional and Public-Sector Procurement
Government-mandated green procurement policies are emerging as a growing demand channel.
In the EU, Canada, and several Southeast Asian countries, publicly funded institutions including schools, hospitals, and government offices are now required to use biodegradable or compostable disposables.
Sustainable lodging certifications (Green Key, LEED) are driving resorts and cruise operators to eliminate single-use plastics to maintain green credentials.
4.2 Regulatory Landscape: Straw Bans and Material Rules by Region
Regulatory frameworks differ significantly across regions in one critical respect: whether compostable bioplastics are treated as “plastic” or exempted.
This distinction determines which materials can legally be sold as straw alternatives and directly shapes the competitive landscape between PLA, PHA, paper, and natural materials.
4.2.1 European Straw Regulations: What Is Banned and What Is Allowed
The EU operates the most restrictive framework globally for compostable polymer straws.
The EU Single-Use Plastics Directive (2019/904) defines “plastic” to include any polymer that can function as a structural component, explicitly covering bio-based, biodegradable, and compostable plastics.
Both PLA and PHA fall within this definition because they are considered chemically modified polymers produced through industrial processes.
| Country | Key Regulation | Prohibited Straw Materials | Allowed Straw Materials |
|---|---|---|---|
| EU (27 states) | SUP Directive 2019/904 | Conventional plastic, PLA, PHA, bio-based plastics, plastic-coated paper | Paper, wood, bamboo, reed, pasta, rice |
| UK (England) | Environmental Protection (Plastic Straws, Cotton Buds and Stirrers) Regulations 2020 | Single-use plastic straws including compostable plastics such as PLA (exemption for medical/accessibility on request) | Paper, bamboo, natural materials |
| Italy | SUP transposition with EN 13432 exemption | Conventional plastic | Certified compostable bioplastics (EN 13432), paper. Exemption subject to EU infringement proceedings |
| France | AGEC Law (additional restrictions) | All single-use plastic including previous exemptions for home-compostable bio-based items | Paper, wood, natural stems |
The UK is sometimes assumed to be a more permissive market than the EU, but UK government guidance explicitly states that compostable plastics such as PLA fall within the scope of England’s single-use plastic straw ban.
Scotland and Wales have implemented similar restrictions.
This means PLA straws are restricted in both the EU (27 member states) and the UK, which together account for the vast majority of the European straw market.
The remaining European market for polymer straws exists primarily through Italy’s exemption for EN 13432-certified compostable bioplastics (though this is under EU infringement proceedings), non-EU and non-UK markets (Switzerland, Norway, Balkans), and the growing adoption of PHA and PBS-blend straws that are being developed to navigate the SUP framework through marine biodegradability and home compostability credentials.
4.2.2 North American Straw Regulations: What Is Banned and What Is Allowed
| Country / State | Key Regulation | Prohibited | Allowed |
|---|---|---|---|
| Canada (federal) | Single-Use Plastics Prohibition Regulations | Conventional plastic straws and compostable plastic straws | Paper, wood, non-plastic materials. Flexible plastic straws available for accessibility |
| California | SB 1335 + AB 1201 (labelling) | Plastic straws in dine-in (on-request only). Misleading “biodegradable” labelling prohibited | Paper, certified compostable (ASTM D6400), bamboo |
| New York | NYC Local Law 142 | Single-use plastic straws | Paper, compostable alternatives |
| Washington | HB 1569 (labelling) | Misleading compostability claims | Products certified to ASTM D6400 or D6868 |
Canada’s federal ban is among the strictest globally because it covers both conventional and compostable plastic straws, unlike most jurisdictions that exempt certified compostable products.
In the United States, the absence of federal legislation produces a patchwork where compostable polymer straws are broadly permitted but subject to strict truth-in-labelling laws requiring third-party certification.
California, New York, and Minnesota have additionally banned PFAS in plant-fibre food packaging, which affects paper straws with moisture-resistant coatings.
4.2.3 Asia-Pacific Straw Regulations: What Is Banned and What Is Allowed
Asia-Pacific is the fastest-growing regulatory region and generally takes a more favourable position toward compostable bioplastics than Europe or Canada.
| Country | Key Regulation | Prohibited | Allowed |
|---|---|---|---|
| China | National plastic ban (2020) + GB/T 41008-2021 | Non-biodegradable plastic straws | PLA, PHA, PBS, PBAT, natural polymers |
| India | SUP rules (July 2022) + IS 17088 | Non-compostable plastic straws | Certified compostable plastics (IS 17088), paper |
| Australia | State-level bans (SA, QLD, VIC, WA, ACT) | Conventional plastic straws | Paper, bamboo, AS-certified compostable plastics |
| South Korea | Zero Waste campaign | Plastic straws in coffee shops | Paper, compostable alternatives |
| Taiwan | Phased SUP ban (from 2019) | Petroleum-based straws in schools, government, fast food | Paper, compostable alternatives |
Insight: China’s regulatory framework is uniquely supportive of compostable polymer straws.
The mandatory national standard GB/T 41008-2021 explicitly provides technical specifications for biodegradable drinking straws made from PLA, PBS, and PHA.
This regulatory clarity, combined with China’s position as the world’s largest PLA producer, is the primary structural driver of Asia-Pacific’s fastest-in-class growth rate.
India’s exemption for certified compostable plastics (IS 17088) makes it one of the most polymer-friendly regulatory environments globally.
Combined with a national SUP ban covering 1.4 billion consumers, India represents a significant long-term growth market.
4.2.4 Rest of World: Emerging Straw Regulations
| Country | Key Regulation | Prohibited | Allowed |
|---|---|---|---|
| Chile | Law 21.368 (2021) | All single-use products in food and beverage | Certified compostable bioplastics, reusables |
| Mexico (Mexico City) | Municipal SUP ban | Single-use plastic straws | Paper, biodegradable alternatives |
| South Africa | Under consideration | Proposed ban on plastic straws (except medical) | Paper, biodegradable materials |
| Kenya | Expanded SUP ban | Single-use plastic straws | Non-plastic alternatives |
| UAE | Green procurement policies | Not formally banned | Sustainability procurement standards in hospitality |
Chile’s Law 21.368 is notable as the first national legislation to ban all single-use products in the food and beverage sector, creating “cradle-to-grave” producer responsibility.
In the Middle East, demand is driven by hospitality-sector sustainability standards rather than legislative bans, with Gulf states adopting green procurement policies for hotels, airlines, and public venues.
5. Compostable Polymer-based Straws – Supply Chain and Competitive Landscape
5.1 Compostable Straws Market — Value Chain
The compostable straw supply chain runs through four stages:
- feedstock sourcing,
- resin production,
- straw manufacturing, and
- distribution to end users.
Each stage has a distinct set of players, cost dynamics, and competitive pressures.
Feedstock sourcing begins with agricultural crops.
PLA production relies on carbohydrate-rich feedstocks, primarily corn (United States), sugarcane (Thailand, Brazil), and sugar beet (Europe).
PHA production uses a different pathway: microbial fermentation of renewable carbon sources such as plant oils, sugars, or waste streams including diverted methane from wastewater and cattle farming.
Plant-fibre composite straws draw on agricultural by-products such as sugarcane bagasse, wheat stems, and rice husks.
Southeast Asia is a major feedstock region, with Vietnam alone producing 3.7 to 4.5 million tonnes of bagasse annually.
Resin production converts these feedstocks into the biopolymer pellets that straw manufacturers use.
This is the most capital-intensive and concentrated stage of the value chain, dominated by a small number of global producers (covered in Section 5.2).
Straw manufacturing is the extrusion and forming stage where resin pellets are melted, shaped through a die, cooled, and cut.
This stage is moderately fragmented, with a mix of global packaging conglomerates and specialised regional manufacturers.
Many straw manufacturers operate as OEM/ODM factories, producing for global brands and distributors rather than selling under their own names.
Distribution connects manufacturers to end users.
Large-scale foodservice distributors (Sysco, US Foods, Gordon Food Service) are the primary channel for commercial buyers.
Supermarkets and hypermarkets lead retail distribution with a 37.4% channel share, while online retail is the fastest-growing channel at a projected 14.2% CAGR.
Direct-to-business specialist brands serve the hospitality and institutional sectors.
End users include foodservice chains, independent restaurants, hotels, airlines, hospitals, schools, and retail consumers.
Global chains such as Starbucks and McDonald’s act as primary demand anchors, converting hundreds of millions of straw units annually.
5.2 Key Players in the Compostable Straw Market by Value Chain Tier
The competitive landscape is moderately fragmented, with the top five players accounting for approximately 38 to 42% of global revenue.
Concentration is higher in paper straws (due to scale economies) and in resin production (due to capital barriers), while specialty segments such as plant-fibre and edible straws remain more fragmented.
5.2.1 Biopolymer Resin Producers
These companies supply the raw material that straw manufacturers convert into finished products.
Entry barriers are high due to the capital intensity and technical complexity of polymer production.
| Company | Headquarters | Key Material | Brand / Product |
|---|---|---|---|
| NatureWorks LLC | USA | PLA | Ingeo |
| TotalEnergies Corbion | Netherlands / Thailand | PLA | Luminy |
| Danimer Scientific | USA (acquired by Teknor Apex, 2025) | PHA | Nodax |
| Kaneka Corporation | Japan | PHA (PHBH) | Green Planet |
| Newlight Technologies | USA | PHA | AirCarbon (carbon-negative, made from methane) |
| Novamont S.p.A. | Italy | Starch-based blends | Mater-Bi |
| BASF | Germany | PBS/PBAT blends | ecovio |
| Mitsubishi Chemical | Japan | PBS | BioPBS |
| Ukhi | India | PLA-based agro-waste blends | EcoGran |
5.2.2 Compostable Straw Manufacturers and Brand Owners
| Company | Headquarters | Focus | Notable Position |
|---|---|---|---|
| Soton (Shuangtong) | China | PLA, paper, bamboo | 30% global straw market share; co-author of China’s national PLA straw standards |
| Huhtamaki Oyj | Finland | Paper, PLA, fibre-based | Global leader in sustainable food packaging |
| Hoffmaster Group (Aardvark Straws) | USA | Paper | Inventor of the modern paper straw; North American benchmark |
| Transcend Packaging | UK | Paper | Europe’s largest paper straw producer; primary supplier to McDonald’s UK |
| Phade (WinCup Inc.) | USA | PHA | World’s first marine-biodegradable PHA straw; over 2 billion units sold |
| BioPak Pty Ltd | Australia | Compostable packaging | Vertically integrated; dominant Asia-Pacific position |
| Vegware Ltd | UK | Compostable foodware | 500+ certified compostable products distributed in 70+ countries |
| Sunbird Straws | India | Natural fibre (coconut leaf) | Patented coconut leaf straw technology |
5.2.3 Foodservice Distributors and Retail Channels
Major foodservice distributors have expanded their biodegradable product lines significantly in recent years.
Sysco, US Foods, and Gordon Food Service now carry dedicated compostable straw ranges for independent restaurants and institutional buyers.
Specialist direct-to-business suppliers including Eco-Products (a Novolex subsidiary), Vegware, and Good Start Packaging serve the hospitality and institutional sectors.
In retail, Walmart, Target, Tesco, and Carrefour feature private-label compostable straw options, and Amazon and Alibaba are the fastest-growing online distribution channels.
5.3 Recent Investment and M&A Activity in the Compostable Straw Market
The compostable straw and sustainable packaging market is experiencing a significant wave of consolidation and capital investment.
This wave is propelled by regulatory pressure and the race toward scalable biopolymer production.
Strategic Acquisitions
Large packaging groups are acquiring specialist bioplastic and paper straw companies to build comprehensive sustainable portfolios.
- Teknor Apex acquired Danimer Scientific (June 2025), the leading PHA producer, following Danimer’s bankruptcy filing in March 2025. This brings PHA production capacity under a major industrial group.
- Huhtamaki acquired a PLA straw manufacturer in Southeast Asia (2024) and a regional Asian manufacturer for $280 million to expand low-cost production.
- BioPak acquired Bygreen (August 2025), an Australian paper straw specialist, to strengthen its sustainable packaging portfolio in Asia-Pacific.
- Hoffmaster Group completed the acquisition of Aardvark Straws, the original inventor of the modern paper straw, to anchor its eco-friendly product range.
- At the broader packaging level, Amcor announced an $8.4 billion planned takeover of Berry Global and Novolex sealed a $6.7 billion purchase of Pactiv Evergreen, both aimed at scaling sustainability R&D and circular design capabilities.
Venture Capital and Startup Funding
Significant investment is flowing into novel compostable materials including seaweed, plant proteins, and agricultural waste-based polymers.
| Company | Country | Funding | Focus |
|---|---|---|---|
| Bambrew | India | $19.65M total (incl. $10.3M Series B, July 2025) | Sustainable packaging from agricultural waste |
| Sulapac | Finland | €15M (2023, co-led by Lifeline Ventures and Chanel) | Bio-based, microplastic-free straw technology |
| Xampla | UK | $14M Series A (September 2025) | Plant-protein-derived home-compostable materials |
| Uluu | Australia | €9M Series A (October 2025) | Seaweed-based PHA production |
| Shellworks | UK | $15M Series A | Plant-based alternative to rigid plastic (Vivomer technology) |
Cumulative venture capital and corporate R&D funding for biopolymer-based straw and packaging alternatives reached an estimated $340 million through 2025.
Production Capacity Expansion
Industrial-scale investment is concentrated in PHA capacity and Asia-Pacific manufacturing.
- Kaneka (Japan) invested approximately 15 billion Japanese yen to expand PHA production at its Takasago facility, targeting 20,000 tonnes of annual capacity.
- Angel Yeast and PhaBuilder announced an $18 million investment to build a 50,000-tonne PHA facility in Yichang, China.
- Between 2024 and 2026, an estimated $650 million was invested globally in compostable coating capacity, alongside $520 million for expanding Asia-Pacific manufacturing.
Stat: The competitive landscape is moving from fragmented regional production toward consolidated, vertically integrated groups with both resin production and straw manufacturing capabilities.
This trend favours companies that can control material costs and certification compliance across the value chain.
6. Compostable Polymer-based Straws – Risks and Challenges
The compostable straw market is growing rapidly, but it faces risks that could slow adoption, erode buyer confidence, or reshape competitive dynamics.
These risks span product performance, health and safety, infrastructure, economics, regulation, and environmental credibility.
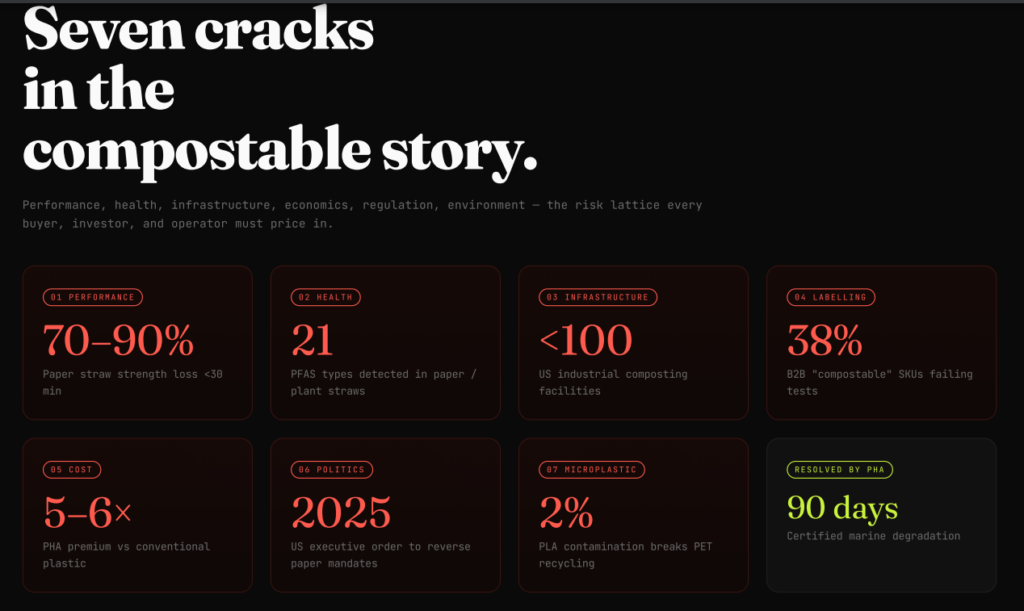
6.1 Functional Performance and Structural Integrity
The most immediate challenge for compostable straws is meeting the basic expectation that a straw works for the duration of a drink.
Paper straws, the market’s largest category, have a well-documented performance problem.
Research from North Carolina State University demonstrates that paper straws experience a 70% to 90% reduction in compressive strength after less than 30 minutes of liquid exposure.
The resulting sogginess is the most consistent source of consumer dissatisfaction with eco-friendly straws and has been cited in a 2025 US Executive Order as a reason to reconsider paper straw mandates.
PLA straws perform better in liquid but soften at approximately 55°C, which makes them unsuitable for hot beverages without additional crystallisation processing.
PHA straws solve both the sogginess and thermal stability problems but remain too expensive for mass-market adoption at current production scale.
The performance gap between conventional plastic and its compostable alternatives remains the single biggest barrier to consumer acceptance, and any material that closes this gap at a competitive price point will capture significant market share.
6.2 Health and Safety Risks: PFAS Contamination and Choking Hazards
A serious and growing concern is the presence of PFAS (per- and polyfluoroalkyl substances) in paper and plant-based straws.
PFAS are added as moisture-resistant coatings but are persistent environmental contaminants linked to adverse health outcomes.
A University of Florida study found 21 types of PFAS in paper and plant-based straws, while conventional plastic straws had zero detectable levels.
This finding undermines the health narrative that has driven the switch from plastic to paper.
Physical safety is a separate risk.
As paper straws disintegrate during use, they create a choking hazard, particularly for young children and people with disabilities.
In the Netherlands, 400 reports were filed of individuals choking on disintegrated paper straw fragments, with 15% requiring medical intervention.
People with disabilities who depend on the durability and flexibility of plastic straws face particular challenges, as many compostable alternatives do not provide equivalent safety or functionality.
Insight: The PFAS issue is a reputational and regulatory risk for the entire eco-friendly straw category, not just paper.
Certified compostable polymer straws that are verified PFAS-free hold a significant trust advantage, but this requires active testing and transparent communication.
6.3 Composting Infrastructure Gaps
There is a significant gap between how compostable straws are labelled and what actually happens to them after use.
Most compostable polymer straws, particularly PLA, require industrial composting facilities operating at sustained temperatures of 55 to 60°C.
If these products enter general waste streams and end up in landfill, they degrade anaerobically and release methane, a greenhouse gas with significantly higher warming potential than CO2.
The infrastructure to process compostable packaging at scale does not exist in most markets.
The United States has fewer than 100 industrial composting facilities capable of processing certified compostable packaging.
Europe has better infrastructure but coverage is uneven.
In Asia-Pacific and emerging markets, industrial composting capacity is minimal.
This creates what the industry calls a “credibility gap”: products are sold as compostable, but the systems required to actually compost them are not available to most consumers or waste operators.
6.4 Greenwashing Risk and Compliance Liability
Procurement managers face material risk from products that fail to meet their sustainability claims.
A 2025 European Bioplastics report found that 38% of products labelled “compostable” in the B2B sector fail to disintegrate within required timeframes.
Additionally, 43% of “compostable” shipping and bag samples contained hidden polyolefin layers that leave microplastic residues.
The financial consequences are direct.
Mislabelled packaging that contaminates commercial composting streams can result in the rejection of entire waste loads, with surcharges of up to $5,000 per tonne.
Under upcoming EU regulations (PPWR, effective August 2026), ambiguous “compostable” claims without proper certification can trigger fines of up to 4% of annual turnover.
California’s AB 1201 and Washington’s HB 1569 impose strict truth-in-labelling requirements that prohibit misleading use of terms like “biodegradable” without third-party certification.
6.5 Cost Premium and Economic Barriers
Compostable straws remain significantly more expensive than conventional plastic.
- Paper straws cost approximately $0.025 per unit versus $0.005 for plastic, a 400% premium.
- PLA straws carry a 3 to 4× cost premium over polypropylene.
- PHA straws are 20 to 40% more expensive than PLA, placing them at 5 to 6× the cost of conventional plastic.
While cost gaps are narrowing (the paper-over-plastic premium has declined from over 200% to 15 to 25% in high-volume contracts), the premium remains a real barrier for cost-sensitive operators, particularly in emerging markets and independent foodservice.
6.6 Regulatory Uncertainty and Political Risk
The regulatory landscape is not uniformly moving toward stricter plastic bans.
In the United States, the 2025 Trump Administration actively sought to reverse paper straw mandates and restore plastic straw use, citing PFAS contamination and functional failures.
This introduces political risk for manufacturers and distributors who have invested in compostable product lines.
More broadly, the patchwork of local, state, and national regulations creates compliance complexity.
A straw that is compliant in one jurisdiction may be prohibited or mislabelled in another.
- PLA is permitted and BPI-certified in the United States but banned under the EU SUP Directive.
- Canada’s federal ban covers both conventional and compostable plastic straws.
- India exempts certified compostable plastics from its SUP-ban.
Managing inventory and labelling across these divergent frameworks is a real operational cost.
6.7 Environmental Contamination: The Microplastics Problem
Compostable bioplastics do not solve the pollution problem if they enter natural ecosystems rather than composting facilities.
PLA is incompatible with PET recycling streams at contamination levels as low as 2%, compromising recycled plastic quality.
In marine environments, studies show that ingested “biodegradable” plastics reduced in mass by only 4.5 to 8.5% over 49 days in sea turtle digestive systems, still causing potential gut blockage.
PHA is the notable exception, with certified marine biodegradability, but it remains a small fraction of total production.
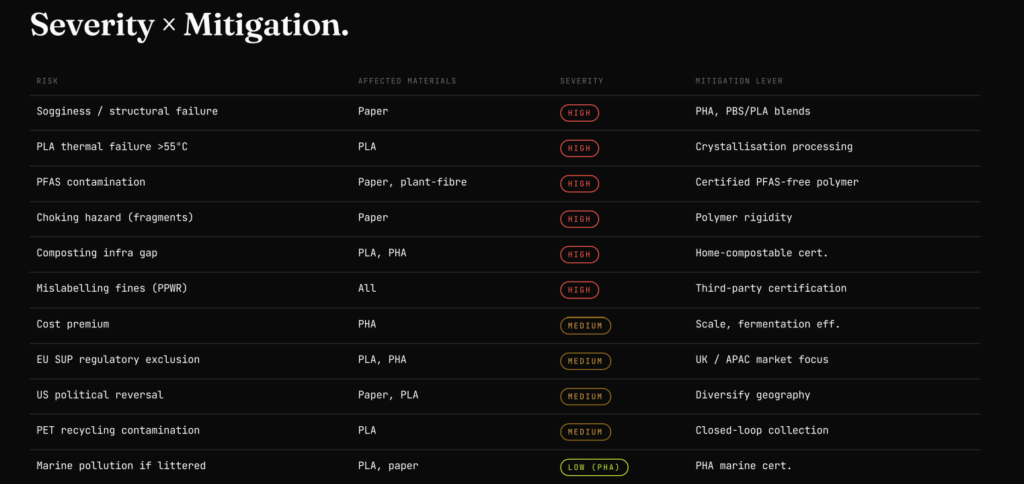
7. Compostable Polymer-based Straw Market – Investment Opportunities
The compostable polymer straw market is forecast to grow from approximately $640 million in 2025 to $2.2 billion by 2035 at a 12.9% CAGR.
Within this growth trajectory, six specific opportunity areas stand out for investors, manufacturers, and strategic buyers.
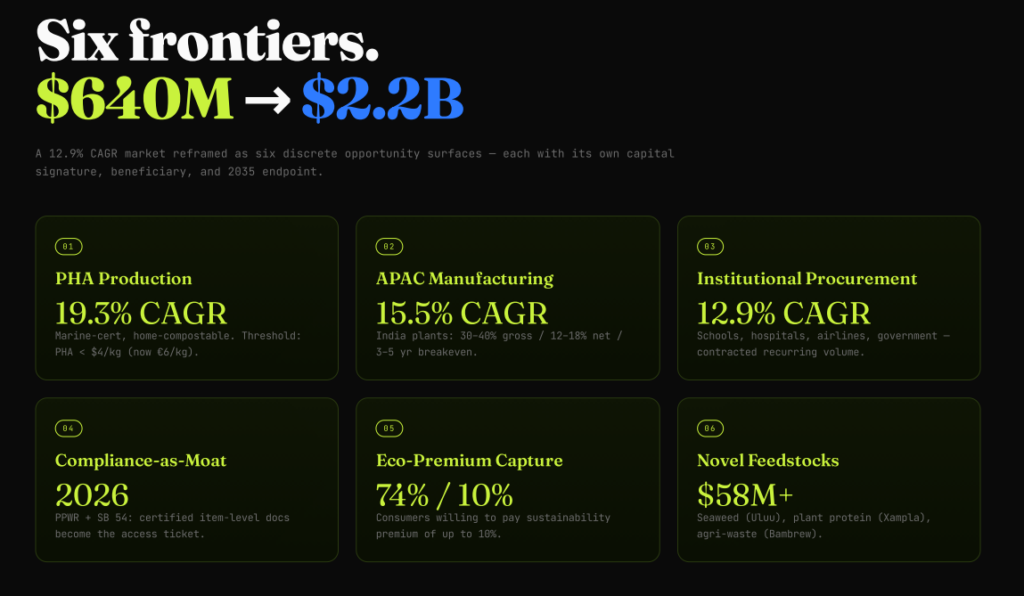
7.1 PHA Biopolymer Production: The Highest-Growth Material Opportunity
PHA (polyhydroxyalkanoate) is the fastest-growing material segment in the compostable straw market, expanding at a CAGR of 19.3%.
PHA’s investment case rests on a unique combination of attributes: it is the only biopolymer that is certified marine-biodegradable, home-compostable, and functionally equivalent to conventional plastic.
It solves the credibility gap that undermines PLA and paper.
Cumulative venture capital and corporate R&D funding for biopolymer alternatives reached approximately $340 million by 2025.
- Kaneka (Japan) invested €126 million to expand PHA capacity to 20,000 tonnes annually.
- Angel Yeast and PhaBuilder committed $18 million toward a 50,000-tonne PHA facility in China.
- Teknor Apex’s acquisition of Danimer Scientific in June 2025 brought the leading PHA brand (Nodax) under a major industrial group.
The critical investment threshold is PHA pricing below $4.00/kg, which industry analysts identify as the point at which PHA becomes broadly competitive with PLA for straw applications.
Current pricing is approximately €6.00/kg.
Companies that achieve this cost reduction through production scale, fermentation efficiency, or waste-feedstock innovations will capture disproportionate market share.
7.2 Asia-Pacific Manufacturing Expansion
Asia-Pacific is the fastest-growing regional market for compostable straws at a 15.5% CAGR, and is projected to overtake North America as the largest regional market by approximately 2033.
China’s position as the world’s largest PLA production hub, combined with progressive plastic straw bans expanding from Tier 1 cities, creates a structural growth environment.
Between 2024 and 2026, an estimated $520 million was invested by Western firms in expanding Asia-Pacific manufacturing capacity.
India has emerged as a particularly attractive manufacturing location, with new biodegradable straw plants projecting gross margins of 30 to 40% and net margins of 12 to 18%, with break-even periods of 3 to 5 years.
The bubble tea market, projected to exceed $4.3 billion by 2027, represents a high-value niche.
Bubble tea requires specialised wide-bore (jumbo) straws that command higher per-unit pricing, and the category is concentrated in Asia-Pacific markets where compostable straw regulation is tightening.
7.3 Institutional and Public-Sector Procurement
The institutional procurement segment (schools, hospitals, airlines, corporate cafeterias, government facilities) is growing at a CAGR of 12.9% and represents the most predictable demand channel in the market.
Government-mandated green procurement policies in the EU, Canada, and Australia now require compostable disposables for publicly funded facilities.
Airlines including British Airways and Singapore Airlines completed transitions to biodegradable straws by 2024.
This segment is less sensitive to consumer preference cycles and provides the kind of contracted, recurring volume that supports manufacturing investment and capacity planning.
Suppliers that can deliver certified, PFAS-free compostable straws at institutional scale with full documentation of certification and chain-of-custody compliance are well-positioned to capture this growing channel.
7.4 Regulatory Compliance as a Competitive Advantage
As compostable packaging regulation tightens globally, certification and labelling compliance is becoming a competitive moat rather than a cost of doing business.
The EU Packaging and Packaging Waste Regulation (PPWR), effective August 2026, and California’s SB 54 make non-compliant inventory a stranded-asset risk.
Wholesalers that cannot provide item-level certification documentation face exclusion from major retail and foodservice accounts.
Conversely, manufacturers that integrate third-party certifications (BPI, TÜV Austria OK Compost), PFAS-free verification, and home-compostable marking (such as Australia’s AS 5810 logo) into their production lines can command premium pricing and secure access to regulated markets.
Insight: There is a growing investment opportunity in what some industry participants call “anti-risk systems”: integrated compliance platforms that provide real-time certification tracking, PFAS testing documentation, and regulatory mapping across jurisdictions.
Companies that package compliance as a service alongside their physical product gain a structural advantage with procurement teams at major foodservice and retail buyers.
7.5 Consumer Willingness to Pay the Eco-Premium
The economics of compostable straws are improving as consumer willingness to pay for sustainable products increases.
Research indicates that 74% of consumers would pay more for sustainable packaging, with 25% willing to accept a premium of up to 10%.
Over 73% of consumers actively prefer establishments offering plastic-free dining.
This “eco-premium” is most actionable in premium foodservice, hospitality, and direct-to-consumer retail, where sustainability positioning translates directly into brand value and customer loyalty.
For operators in these segments, the cost difference between a conventional plastic straw and a certified compostable polymer straw is a small fraction of the overall transaction value and can be absorbed or passed through without resistance.
7.6 Novel Materials: Seaweed, Plant Protein, and Agricultural Waste
Early-stage investment is flowing into materials beyond PLA and PHA.
- Seaweed-based polymers (Uluu, Australia, €9 million Series A),
- plant-protein-derived compostable materials (Xampla, UK, $14 million Series A), and
- agricultural waste-based packaging (Bambrew, India, $19.65 million total funding)
- agro-residue biopolymers (Ukhi, India, approximately $2.5 million across pre-seed and seed rounds)
These materials target home compostability and marine degradability without the production cost challenges of current PHA, and several have attracted strategic investment from major consumer brands (Chanel’s co-investment in Sulapac; L’Oréal’s backing of Kelpi through a $115 million accelerator programme).
These investments are early-stage and high-risk, but they represent the materials pipeline that will shape the compostable straw market beyond 2030.
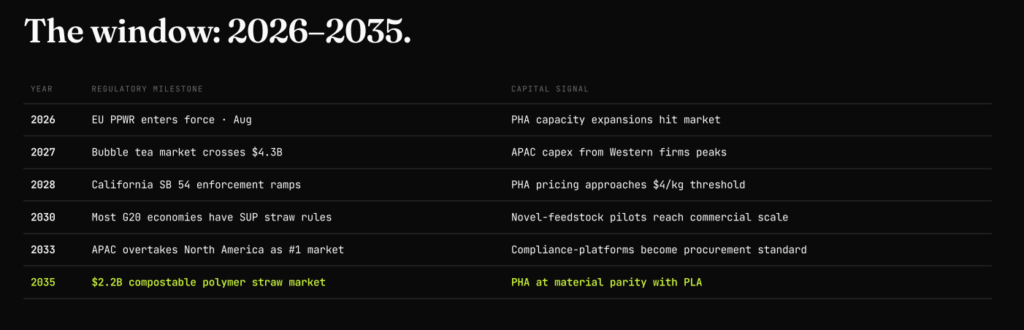
Conclusion
The compostable polymer straw market sits at the intersection of regulatory pressure, material science, and shifting consumer expectations.
It is a market that did not meaningfully exist a decade ago and is projected to exceed $2 billion within the next ten.
The opportunity is real, but so are the risks.
PLA dominates today but faces a regulatory ceiling in the world’s most regulated market.
PHA offers a superior environmental profile but must achieve cost parity to scale.
Paper holds the largest share of the broader eco-friendly straw market but carries performance and safety liabilities that are becoming harder to ignore.
For manufacturers, investors, and procurement teams, the path forward requires clarity on which materials, which markets, and which certifications will define the next phase of this transition.
The long-term direction of the market is increasingly clear:
- regulation will continue to restrict conventional single-use plastics,
- foodservice operators will continue searching for functional alternatives that do not compromise customer experience,
- buyers will increasingly demand PFAS-free and verifiably compostable products, and
- material innovation will continue shifting the economics in favour of next-generation biopolymers.
The companies that succeed over the next decade are likely to be those that combine scalable manufacturing, credible certification, regulatory adaptability, and material performance close to conventional plastic at commercially viable pricing.
The compostable polymer straw market remains early in its evolution, but it is transitioning rapidly from a niche sustainability category into a structurally significant segment of the global foodservice packaging industry.
© 2026 Ukhi Bioplastics Private Limited. All rights reserved.
References
1. Standards Australia. (2010). Biodegradable plastics—Biodegradable plastics suitable for home composting (AS 5810—2010).
2. Moran, M. E. (2018). An environmental and cost comparison between polypropylene plastic drinking straws and a “greener” alternative: An Oberlin case study (Honors Papers 169). Digital Commons at Oberlin.
3. Gutierrez, J. N., Royals, A. W., Jameel, H., Venditti, R. A., & Pal, L. (2019). Evaluation of paper straws versus plastic straws: Development of a methodology for testing and understanding challenges for paper straws. BioResources, 14(4), 8345-8363.
4. DataM Intelligence. (2026). Biodegradable straws market forecast 2026-2033.
5. TÜV Austria Belgium. (2024, July). Comparison of standards for industrial compostability (Information Document 415).
6. LifeMade Products LLC. (2026). Compostable vs. paper straws: Key differences.
7. Nanjing Innomec Machinery and Electric Co., Ltd. (2024). Drinking straw extrusion machine, hydraulic plate making machine – YINKO.
8. Journal of Bioresources and Bioproducts. (2025, March 12). Eco-friendly innovation: Industrial-scale all-natural bamboo drinking straw inspired by bamboo’s flexibility and toughness.
9. Greenprint Products. (2026, April 20). Emerging materials for compostable straws: Full guide.
10. Ramadhan, W., Santoso, J., Uju, Dewangga, R. G. L., Natanael, M., Luthfiansyah, M. A., Rachmawati, A. Y., & Santosa, Z. A. (2025). Investigation of polymer blend formulation and homogenization dynamics in the development of biodegradable, hydrophobic, and heat-resistant seaweed-based bioplastic straws. Sustainable Food Technology, 3, 2282–2296.
11. Shandong Orizon Biomaterials Co., Ltd. (2025). OK Compost HOME vs INDUSTRIAL: Key differences explained.
12. CJ Biomaterials. (2024). PHACT straws collateral – CB0400A & CA1270P.
13. European Bioplastics e.V. (2025, September 17). Safety of bioplastics as food contact materials.
14. Bunzl Catering Supplies. (2024, September). Sustain update Sept 24.
15. Archive Market Research. (2026). PHA straw 2026-2033 analysis: Trends, competitor dynamics, and growth opportunities.
16. Dataintelo. (2026). Biodegradable straws market research report 2034.
17. DataM Intelligence. (2026). Biodegradable straws market forecast 2026-2033.
18. Fortune Business Insights. (2026). Paper straw market size, share & industry analysis, by material (virgin paper and recycled paper), by product (printed and non-printed), by application (foodservice and household), and regional forecast, 2026-2034.
19. Future Market Insights. (2026). Straw market | global market analysis report – 2036.
20. Global Growth Insights. (2025). Which are the top 21 paper straw companies in 2025?
21. KBV Research. (2023). Europe paper straw market size, share & industry trends analysis report.
22. Mark & Spark Solutions. (2026). Asia Pacific drinking straw market forecast & trends to 2031.
23. MarkNtel Advisors. (2024). Global straw market research report: Forecast (2026-2032).
24. Markets and Data. (2024). Drinking straw market size, share, industry forecast and report 2031.
25. MarketDigits. (2024). Paper straw market – Global forecast from 2024-2032.
26. Market.us. (2025). Paper straw market size, share, demand | CAGR of 15.7%.
27. Polaris Market Research. (2025). Paper straw market share, size, trends & industry analysis report, 2025 – 2034.
28. Precedence Research. (2026). Paper straw market size to hit USD 19.04 billion by 2035.
29. Research and Markets. (2026). Straw market size, competitors, trends & forecast to 2030.
30. Spherical Insights. (2025). Global straw market size, share, trends, forecasts to 2033.
31. Stellar Market Research. (2026). Paper straw market global industry analysis and forecast (2026-2032).
32. Technavio. (2024). Paper straw market analysis – US, China, Germany, Italy, India – Size and forecast 2024-2028.
33. The Business Research Company. (2026). Global straw market report 2026.
34. The Report Cube. (2026). Global straw market report and forecast 2026-2034.
35. Aliotta, L., Seggiani, M., Lazzeri, A., Gigante, V., & Cinelli, P. (2022). A brief review of poly (butylene succinate) (PBS) and its main copolymers: Synthesis, blends, composites, biodegradability, and applications. Polymers, 14(4), 844. https://doi.org/10.3390/polym14040844
36. BenchChem. (2026, April). Application notes and protocols for melt processing of poly(butylene succinate) blends. https://www.benchchem.com/product/b1584996/docs#application-notes-and-protocols-for-melt-processing-of-poly-butylene-succinate-blends
37. Bluepha. (n.d.). PHA bioplastic. Retrieved from http://en.bluepha.com/pha-bioplastic
38. BusinessAnalytiq. (2026, May). Polylactic acid (PLA) price index. https://businessanalytiq.com/price-indexes/polylactic-acid-pla/
39. Canellas, E., Vera, P., Nerin, C., Goshawk, J., & Dreolin, N. (2024). Exploring soda contamination coming from paper straws through ultra-high-pressure liquid chromatography coupled with an ion mobility-quadrupole time-of-flight analyzer and advanced statistical analysis. Food Packaging and Shelf Life, 41, 101237. https://doi.org/10.1016/j.fpsl.2024.101237
40. Carus, M., vom Berg, C., Skoczinski, P., Porc, O., Poranki, N., Tweddle, G., Stratmann, M., Dammer, L., & Puente, Á. (2026, April). Support for bio-based feedstock in plastic packaging analysis under the Packaging and Packaging Waste Regulation (EU) 2025/40. European Commission; Directorate-General for Environment.
41. ChemAnalyst. (2026, March). Succinic acid market analysis: Industry market size, plant capacity, production, operating efficiency, demand & supply, end-user industries, sales channel, regional demand, company share, 2015-2036. https://www.chemanalyst.com/industry-report/succinic-acid-market-395
42. Department for Environment, Food and Rural Affairs. (2020, May). Proposal to ban the supply of plastic drinking straws to the end user in England. GOV.UK; Regulatory Policy Committee.
43. Dimension Market Research. (2025, March). Eco-friendly straws market by material type, by biodegradability type, by straw length, by user type, by end use – Global industry outlook, trends and forecast 2025-2034. https://dimensionmarketresearch.com/report/eco-friendly-straws-market/
44. European Commission. (2021, June 7). Commission guidelines on single-use plastic products in accordance with Directive (EU) 2019/904 of the European Parliament and of the Council on the reduction of the impact of certain plastic products on the environment. Official Journal of the European Union, C 216/1.
45. Future Market Insights. (2025, July 16). Compostable straws market – Share, size & forecast 2025-2035. https://www.futuremarketinsights.com/reports/compostable-straws-market
46. Future Market Insights. (2026, February 24). Straw market | Global market analysis report – 2036. https://www.futuremarketinsights.com/reports/straw-market
47. Koller, M., & Mukherjee, A. (2022). A new wave of industrialization of PHA biopolyesters. Bioengineering, 9(2), 74. https://doi.org/10.3390/bioengineering9020074
48. MarketsandMarkets. (2025, December). Polyhydroxyalkanoate (PHA) market by type, production method, application, and region – Global forecasts to 2030. https://www.marketsandmarkets.com/Market-Reports/pha-market-395.html
49. Moy, C.-H., Tan, L.-S., Shoparwe, N. F., Shariff, A. M., & Tan, J. (2021). Comparative study of a life cycle assessment for bio-plastic straws and paper straws: Malaysia’s perspective. Processes, 9(6), 1007. https://doi.org/10.3390/pr9061007
50. Patidar, R., Thakur, V. K., Chaturvedi, R., Khan, A., Mallick, T., Gupta, M. K., & Pappu, A. (2024). Production of natural straw-derived sustainable polymer composites for a circular agro-economy. ACS Sustainable Resource Management, 1(8), 1729-1737. https://doi.org/10.1021/acssusresmgt.4c00054
51. Romero Mosquera, M. (2019). Banning plastic straws: The beginning of the war against plastics. Environmental and Earth Law Journal, 9, 1-30.
52. Sahu, Y. (2024, November). Asia Pacific polybutylene succinate market outlook to 2030. Ken Research.
53. Singreen Packaging. (2025, September 17). Are paper straws cheaper than plastic straws? https://www.singreenpackage.com/are-paper-straws-cheaper-than-plastic-straws/
54. Xampla. (2022). Regulatory landscape for single-use plastics and microplastics in the UK and Europe.
55. DataM Intelligence. (2026, April 27). Biodegradable straws market forecast 2026-2033. https://www.datamintelligence.com/research-report/biodegradable-straws-market
56. Department for Environment, Food & Rural Affairs. (2024, October 7). Single-use plastics bans and restrictions. GOV.UK. https://www.gov.uk/guidance/single-use-plastics-bans-and-restrictions
57. Dimension Market Research. (2025, March). ECO-friendly straws market size to reach USD 3.0 bn by 2034. https://dimensionmarketresearch.com/report/eco-friendly-straws-market/
58. Environment and Climate Change Canada. (2022). Single-use plastics prohibition regulations: Guidance for selecting alternatives. Government of Canada.
59. European Bioplastics. (2021, October 8). Single-use plastics directive. https://www.european-bioplastics.org/policy/eu-policy-framework/single-use-plastics-directive/
60. Future Market Insights. (2025, July 16). Compostable straws market: Share, size & forecast 2025-2035. https://www.futuremarketinsights.com/reports/compostable-straws-market
61. Ministry for the Environment. (2021, May). Regulatory impact statement: Phasing out specific hard-to-recycle plastics and single-use plastic items. Government of New Zealand.
62. Rossouw, R., Gihring, K., Crowe Pettersson, K., & Kasner, S-A. (2023). Plastic bans and phase-outs: Benefits for South Africa. WWF South Africa.
63. Sharma, R. (2026, March). Biodegradable straws market research report 2034. Dataintelo. https://dataintelo.com/report/biodegradable-straws-market
64. Strategy& Middle East. (2025, August 6). The new plastics economy. PwC.
65. Stuart, G., Takase, K., Streatfeild, C., & Tso, G. (2026). ESG policy guide 2026. Baker McKenzie.
66. The Pew Charitable Trusts & SYSTEMIQ. (2020). Breaking the plastic wave: A comprehensive assessment of pathways towards stopping ocean plastic pollution. https://www.pewtrusts.org/en/research-and-analysis/reports/2020/07/breaking-the-plastic-wave
67. USAID & Asia-Pacific Economic Cooperation. (2024, March). Promoting compostable bioplastics in the APEC region: Policy frameworks to enable trade, investment and innovation.
68. Yum China Holdings, Inc. (2023, March). Creating a responsible ecosystem: 2022 sustainability report.
69. James, B. D., Sun, Y., Pate, K., Irving, B., & Ward, C. P. (2025). Strategies for designing circular, sustainable, and nonpersistent consumer plastic products: A case study of drinking straws. Environmental Science & Technology, 59(43), 18177–18189.
70. Dataintelo. (2025). Biodegradable straws market research report 2034.
71. Future Market Insights. (2025). Compostable straws market – Share, size & forecast 2025-2035.
72. Singreen Packaging. (2026). Best biodegradable straws manufacturers in the world (2026).
73. Dimension Market Research. (2025). Eco-friendly straws market size to reach USD 3.0 bn by 2034.
74. Nguyen, T. V. A., & Tran, H. M. P. (2025). Solutions to promote green consumer behavior: A case study of bagasse based bioproducts in the circular economy model in Vietnam. GPH-International Journal of Business Management, 8(8), 1–17.
75. Lovett, J., & de Bie, F. (2016). Sustainable sourcing of feedstocks for bioplastics. Corbion.
76. Teknor Apex. (2025, June 10). Teknor Apex acquires Danimer Scientific to further diversify sustainable materials portfolio.
77. Technavio. (2024). Foodservice disposables market analysis – US, Canada, China, UK, Germany – size and forecast 2024-2028.
78. 24ChemicalResearch. (2026). Fully biodegradable straw material market demand, supply balance and capacity outlook and forecast 2026-2033.
79. Prismane Consulting. (2025, June 7). Polyhydroxyalkanoates (PHA) market dynamics and demand analysis.
80. The Business Research Company. (2026). Paper straw market report 2026.
81. Straits Research. (2026). Compostable plastic market size, share, demand and report by 2034.
82. HKEXnews. (2022). Biodegradable masterbatches.
83. PESTEL-analysis.com. (2025, October 5). What is competitive landscape of Huhtamaki company?
84. Torise Biomaterials. (2026, February 28). 2026 Global plastic ban map: The wholesaler’s strategic roadmap to compliance and premium profits.
85. Singreen Packaging. (2025, September 17). Are paper straws cheaper than plastic straws?
86. Sharma, R. (2026, March). Biodegradable straws market research report 2034. Dataintelo.
87. Growth Market Reports. (n.d.). Bioplastic straw market research report 2033.
88. Torise Biomaterials. (2026, April 28). Compostable packaging [truth vs. greenwash]: How to choose truly sustainable B2B solutions.
89. Liu, Y., Li, N., Zhang, X., Wei, T., Ma, M., Sun, Q., Li, M., & Xie, F. (2024, June 30). Eco-friendly drinking straws: Navigating challenges and innovations. Trends in Food Science and Technology, 148, Article 104511. https://doi.org/10.1016/j.tifs.2024.104511
90. PureStalk Learn. (2026, May 8). Home compostable vs industrial compostable: What’s the difference?
91. Choudhury, R. (2026, March 11). How to setup biodegradable plastic granules manufacturing plant in India 2026: A complete guide of cost and revenue. India Plant Setup News and Updates.
92. Wang, S. (2025, October 24). Methane-based straws have lower environmental impact than paper, study finds. Packaging Insights.
93. Domestic Policy Council. (2025, March 28). National strategy to end the use of paper straws. The White House.
94. Stellar Market Research. (2026, April 21). Paper straw market global industry analysis and forecast (2026-2032).
95. Tembo Paper. (2020, May 22). Public willing to pay more for sustainable packaging.
96. Wildlife and Countryside Link. (2019, October). Standards for biodegradable, compostable and bio-based plastics: Call for evidence.
97. Collacott, L. (2022, May 26). Where compostable packaging fits in a circular economy. Ellen MacArthur Foundation.
98. Fofana, O. (2026, February 11). Why compostable packaging fails. Packaging Gateway.
Company Directory
Ukhi India Private Limited
Plot -141, IMT Main Rd, Industrial Area, Sector 68
Faridabad, Haryana 121004, India
Phone: +91-96259 68232
Email: info@ukhi.com
Website: www.ukhi.com
About the Authors
This report is a collective effort by the Ukhi Research Division, with support from our leadership team and technical experts.
Lead Author:
Vishal Vivek
Co-founder & CEO
Email: vishal@ukhi.org
Contributors:
This work also benefited from contributions by Ukhi’s in-house research, commercial, and product teams.
For Further Inquiries
For questions, permissions, or requests related to this report or other Ukhi publications, please contact:
Research & Publications
Ukhi Bioplastics Private Limited
Email: info@ukhi.com
Phone: +91-96259 68232
Address: Plot -141, IMT Main Rd, Industrial Area, Sector 68, Faridabad, Haryana 121004, India
Website: www.ukhi.com
For media queries or speaking opportunities, please email Vishal Vivek (vishal@ukhi.org).
Note:
For the latest updates, product launches, or to connect with the authors, please visit www.ukhi.com or follow us on LinkedIn and other social media channels.